How many wins does it take to make the NFL playoffs?
Ten wins is close to safe, and nine is less than even. In the five 17-game seasons with a 14-team field, 2021 to 2025, teams that won 10 games made the playoffs 15 times out of 16 (94%), teams that won 9 made it 9 times out of 23 (39%), and teams that won 8 made it 2 times out of 18, both as division winners at 8-9. All 44 teams with 11 or more wins got in, and no team with 7 or fewer did. The last time an 11-win team missed was New England at 11-5 in 2008.
Related: NFL playoff picker · 2026 standings
Playoff fields for 2002-2025 from the official tiebreaking procedures applied to the nflverse game log, checked against each season's postseason games. 2026 records through Thursday of week 6.
Wins and Playoff Berths, 2002-2025
The table counts every team-season since the league went to 32 teams in 2002, by its number of wins, and how many of them made the playoffs. The format changed twice, so the seasons are split three ways: 16 games with six playoff teams per conference (2002-2019), 16 games with seven (2020), and 17 games with seven (2021-2025). Ties are not counted as wins.
| Wins | 2002-2019 (16 games, 12 teams) | 2020 (16 games, 14 teams) | 2021-2025 (17 games, 14 teams) |
|---|---|---|---|
| 6 or fewer | 0 of 187 | 0 of 12 | 0 of 42 |
| 7 | 2 of 68 | 1 of 4 | 0 of 17 |
| 8 | 6 of 65 | 1 of 3 | 2 of 18 |
| 9 | 25 of 63 | none | 9 of 23 |
| 10 | 55 of 64 | 1 of 2 | 15 of 16 |
| 11 | 44 of 45 | 5 of 5 | 12 of 12 |
| 12 or more | 84 of 84 | 6 of 6 | 32 of 32 |
The shape barely moved when the season grew. Nine wins got a team in about 40% of the time in both eras: 25 of 63 under the old format, 9 of 23 since 2021. Ten wins became safer: 55 of 64 (86%) under the old format, 15 of 16 since. Part of that is the seventh playoff seat added in 2020, and five seasons cannot separate it from the 17th game; the 17-game era page makes the same point about win totals in general.
The Exhibit
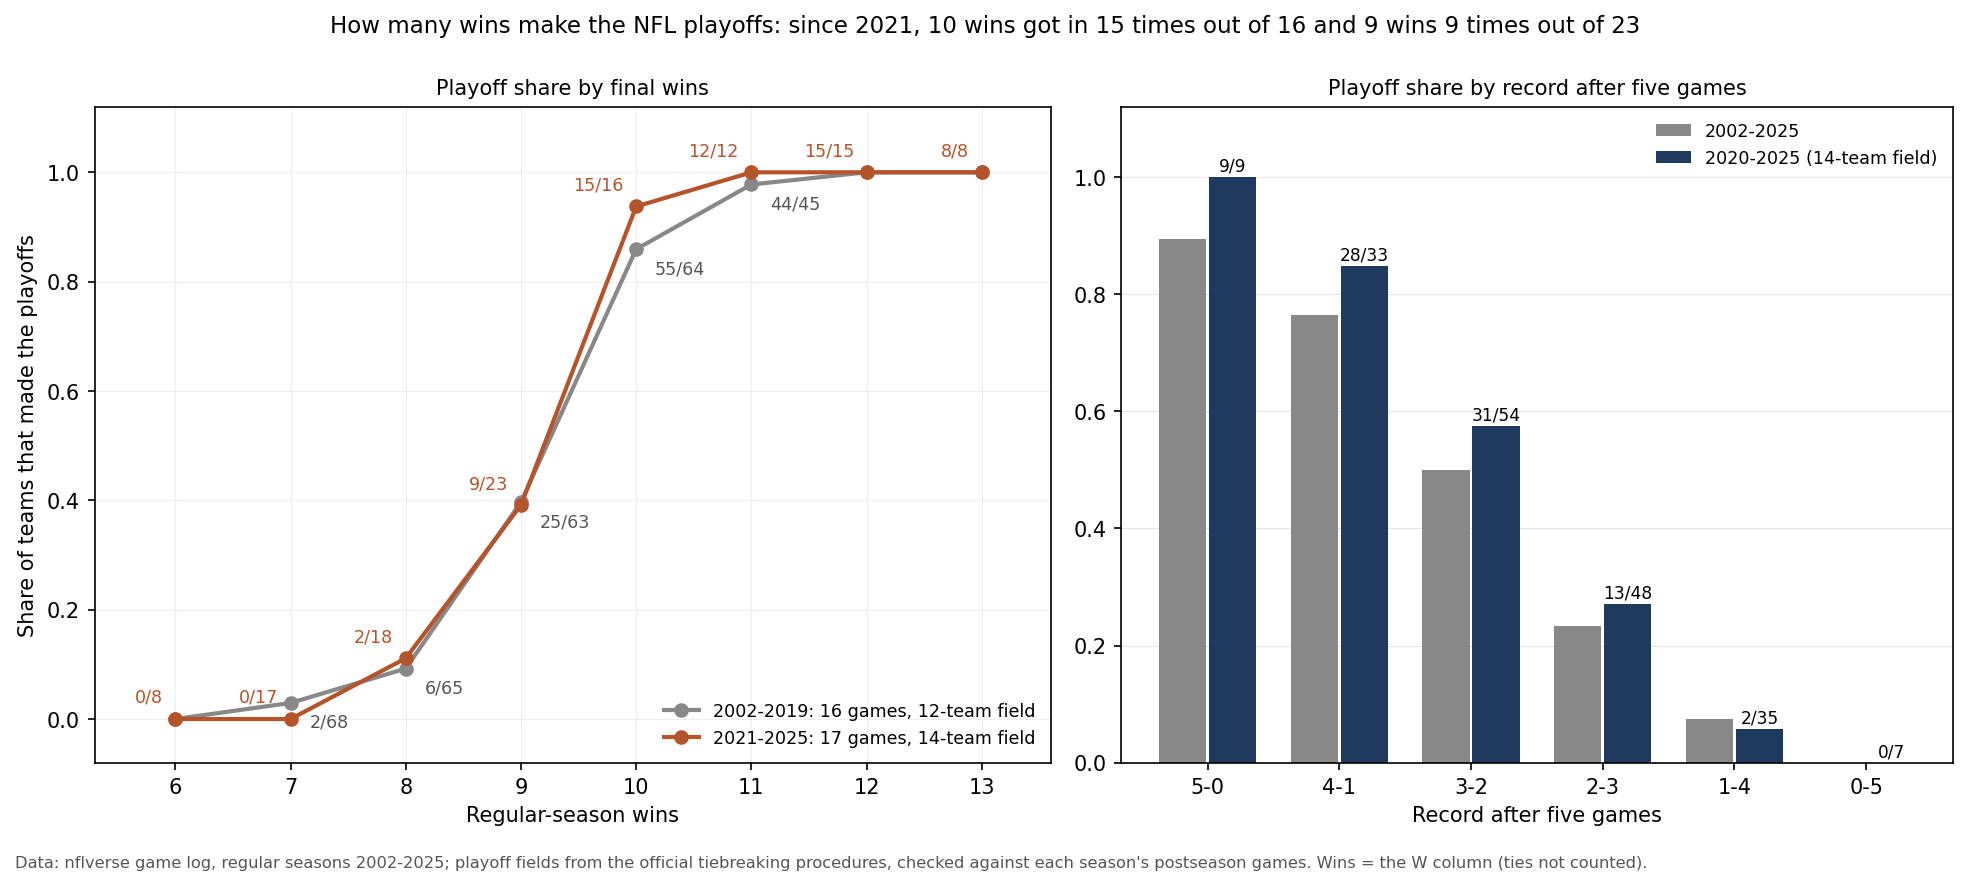
Where the Line Has Fallen Since 2021
- The last seat. The seventh seed, the last team in, finished 9-8 four times, 9-7-1 twice, 10-7 twice and 11-6 twice in the ten conference-seasons from 2021 to 2025. No wild card in those five seasons won fewer than 9 games.
- The top seed. The No. 1 seeds won between 12 and 15 games: two at 12, two at 13, four at 14 and two at 15.
- The division exception. A division title is the one way in below the wild-card line. Four of the 40 division winners from 2021 to 2025 won 9 or fewer games, and two won at 8-9: Tampa Bay in 2022 and Carolina in 2025. Meanwhile the best wild card of the period was 14-3, Minnesota in 2024.
Since 2002 the fewest wins in a playoff field were 7-9, by Seattle in 2010 and Washington in 2020, and 7-8-1, by Carolina in 2014. All three were division winners.
Two Teams That Won Enough and Missed
New England, 2008. The Patriots went 11-5 and tied Miami for the AFC East. Miami won the division on the tiebreakers, and the two wild cards went to teams at 12-4 and 11-5, leaving New England seventh in a six-team field. San Diego won the AFC West that year at 8-8 and got in. It is the only 11-win team since 2002 to miss.
Seattle, 2024. Seattle went 10-7 and tied the Rams for the NFC West. They split their two games and both went 4-2 in the division; the tie went down the list to strength of victory, which the Rams won. The three NFC wild cards were 14-3, 12-5 and 11-6, so a 10-7 record was not enough, while Tampa Bay won the NFC South at 10-7. Seattle is the only 10-win team to miss in the 17-game era. The tiebreakers explainer lists every step in order.
Where 2026's Teams Stand
Through Thursday of week 6, 28 teams have played five games, Kansas City and Carolina four, and Denver and Seattle six. The table groups the 32 teams by record, gives the wins each still needs to reach 10, and shows how teams with the same record after the same number of games have done since 2020 and since 2002.
| Record | Teams | Games left | Wins needed for 10 | Made playoffs, 2020-2025 | Made playoffs, 2002-2025 |
|---|---|---|---|---|---|
| 5-0 | Minnesota, San Francisco | 12 | 5 | 9 of 9 | 42 of 47 |
| 4-0 | Kansas City | 13 | 6 | 14 of 14 | 58 of 67 |
| 4-1 | Baltimore, Buffalo, Jacksonville | 12 | 6 | 28 of 33 | 91 of 119 |
| 4-2 | Denver | 11 | 6 | 36 of 46 | 119 of 182 |
| 3-1-1 | NY Giants | 12 | 7 | 1 of 1 | 2 of 2 |
| 3-2 | Chicago, Cincinnati, Cleveland, Detroit, Green Bay, Las Vegas, New England, Pittsburgh | 12 | 7 | 31 of 54 | 110 of 220 |
| 3-3 | Seattle | 11 | 7 | 14 of 44 | 62 of 187 |
| 2-2 | Carolina | 13 | 8 | 24 of 62 | 95 of 252 |
| 2-3 | Atlanta, Dallas, Indianapolis, LA Rams, NY Jets, Philadelphia | 12 | 8 | 13 of 48 | 45 of 193 |
| 1-3-1 | Washington | 12 | 9 | 0 of 3 | 0 of 4 |
| 1-4 | Arizona, Houston, New Orleans, Tampa Bay | 12 | 9 | 2 of 35 | 10 of 133 |
| 0-5 | LA Chargers, Miami, Tennessee | 12 | 10 | 0 of 7 | 0 of 43 |
The biggest group is the eight teams at 3-2. A 3-2 team needs 7-5 the rest of the way to reach 10 wins, and since 2020 about four in seven teams at 3-2 after five games made the playoffs (31 of 54). At 2-3 the climb is 8-4 and the share falls to 13 of 48. The 3-1-1 and 1-3-1 rows come from the Giants-Washington tie and have almost no history behind them.
A record is not the whole story: division, schedule and tiebreakers decide who gets the last seats, as Seattle found in 2024. The playoff picker lets you choose the winner of every remaining game, ties included, and seeds both conferences with the official tiebreakers, so you can see what a given number of wins does for a given team. The standings are updated every game day.
What This Page Does Not Show
- Any team's chances this year. The history rows describe past teams with the same record, not the 2026 teams' schedules or strength.
- The 17th game apart from the seventh seat. Both changes came within two seasons, and five seasons of 17 games cannot pull them apart.
- Seasons before 2002. With 31 teams or fewer and different divisions, the earlier fields are not comparable.
Method and Sources
field   = the four division winners plus two wild cards per conference (2002-2019) or three (2020-2025), each
          division and each wild-card tie broken by the league's procedure (standings_tiebreak.py)
check   = for all 24 seasons the computed field equals the teams in that season's postseason games, the computed
          byes equal the teams that skipped the wild-card round, and the wild-card pairings match
wins    = the W column of the final regular-season record; ties are not wins
after N = the team's record after its first N regular-season games, in date order
The script make_wins_to_make_playoffs_chart.py rebuilds every playoff field from 2002 to 2025, checks each against the postseason games, counts the table, finds the extremes and the two worked examples, reads the 2026 records from the standings file, draws the exhibit and asserts every number on this page.
Sources: the nflverse game log, 2002-2025 regular and postseason games, identical to the copy pulled 9:21 am ET on October 18, 2026; 2026 records through Seattle at Denver on Thursday, October 15.
Further reading
- NFL Playoff Picker 2026: pick the games and see the seeds
- NFL Tiebreakers Explained: the division and wild-card steps in order
- Five Years of the 17-Game Schedule: what the longer season did to records
- The 0-2 Hole Is Mostly the Two Games: what an 0-2 start means
- 2026 NFL Standings: updated every game day
Go deeper
Want the code behind these metrics? Work through the 43-chapter NFL analytics tutorial.
Browse tutorials Free tools