How many plays are in an NFL game?
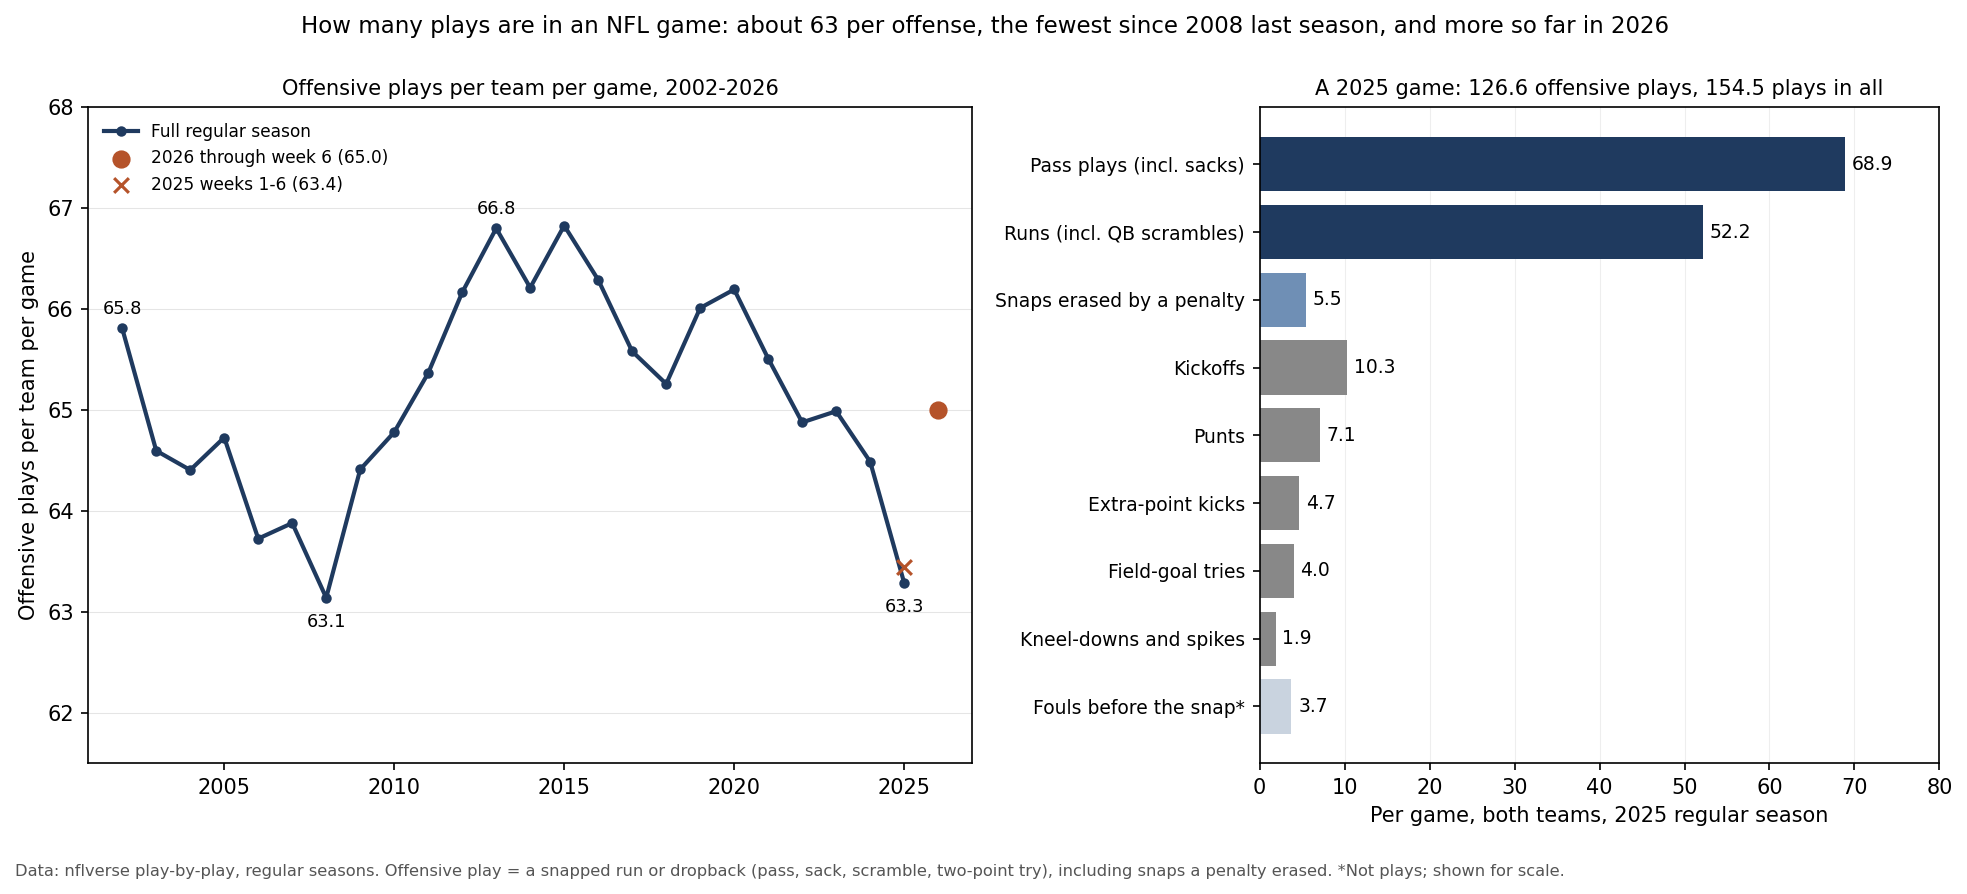
In the 2025 regular season each offense ran 63.3 plays a game, or 126.6 for both teams: every snapped run, pass, sack and scramble, including the 5.5 a game that a penalty wiped out. Add 26.0 kicking plays and 1.9 kneel-downs and spikes, and a typical game had 154.5 plays in all, over a median of 3 hours 2 minutes from the opening kickoff to the final play. The 2026 season is running higher so far: 65.0 offensive plays per team through week 6, against 63.4 at the same point of 2025.
Related: snap counts and player usage · game script
Counts from nflverse play-by-play: every regular-season game of 2002-2025, and the 92 games of 2026 through Sunday, October 18, read October 19, 2026.
A 2025 Game, Play by Play Type
The answer depends on what you count. A "snap" in everyday use usually means an offensive play, but a game also has kickoffs, punts and kicks, and some snaps never count because a flag erased them. Here is the average 2025 game, both teams together.
| Kind of play | Per game, both teams | Notes |
|---|---|---|
| Pass plays | 68.9 | includes 4.7 sacks |
| Runs | 52.2 | includes 4.0 quarterback scrambles |
| Snapped plays erased by a penalty | 5.5 | the play ran, then a flag wiped it out |
| Offensive plays | 126.6 | 63.3 per team; two-point tries (0.5 a game) are in here |
| Kickoffs | 10.3 | |
| Punts | 7.1 | |
| Extra-point kicks | 4.7 | |
| Field-goal tries | 4.0 | |
| Kneel-downs | 1.6 | |
| Spikes | 0.3 | |
| All plays | 154.5 | |
| Fouls before the snap | 3.7 | false starts, delay of game and the like; not plays |
Leave out the erased snaps and 121.1 offensive plays a game stood, 60.6 per team; a play wiped out by a penalty does not count in a team's statistics. A player is still on the field for those erased snaps, which is one reason snap counts and play counts can differ; the snap counts page explains how individual players' shares are measured.
The Exhibit
Fewer Plays Lately, and More in 2026 So Far
Offenses ran 65.8 plays per team per game in 2002, and the count has moved in a band of about four plays since. It hit 63.1 in 2008, climbed to 66.8 in 2013 and again in 2015, and stayed between 65.3 and 66.3 from 2016 through 2020. Since then it has mostly fallen: 65.5 in 2021, 64.9 in 2022, 65.0 in 2023, 64.5 in 2024 and 63.3 in 2025, the second-lowest of the 24 seasons and the lowest since 2008.
The first six weeks of 2026 have turned that around, at least for now: 65.0 plays per team, against 63.4 in the first six weeks of 2025. That is about 1.6 more plays per offense, or roughly three more snaps a game. Ninety-two games is a real sample, but it spans six of the season's 18 weeks, so the full-season figure is the one to watch.
How Much One Game Can Vary
The average hides a wide range. In 2025 the middle 80% of offenses ran between 51 and 75 plays in a game, with a median of 64; the fewest was 35 and the most 96. Since 2002, three offenses have reached 100 plays, Tennessee in 2021 and Cincinnati and Kansas City in 2022, and all three games went to overtime; only Kansas City won. The fewest was 33, by Tennessee in 2006, and Tennessee still beat Jacksonville 24-17. The most in one game by both teams was 178, when Washington and Cincinnati tied 27-27 in overtime at Wembley Stadium in 2016.
Running more plays does not mean winning. From 2002 to 2025, the team with more offensive plays won 3,039 of 6,032 games, a .504 share (176 games with equal counts, and ties, left out). Winners averaged 65.7 plays and losers 64.6, but the mix was different: winners ran 29.4 designed runs and 36.2 dropbacks, losers 22.2 and 42.4. A team that leads runs the ball to use the clock, and a team that trails throws to catch up, which is what the game-script page is about.
The 2026 Offenses Running the Most and Fewest Plays
| Most plays per game | Games | Plays | Fewest plays per game | Games | Plays |
|---|---|---|---|---|---|
| Chicago | 6 | 75.5 | Tennessee | 6 | 55.7 |
| Carolina | 5 | 71.8 | San Francisco | 5 | 57.8 |
| LA Rams | 6 | 70.8 | Miami | 5 | 58.4 |
| New Orleans | 6 | 70.0 | NY Jets | 6 | 60.7 |
| Arizona | 6 | 69.5 | Denver | 6 | 60.7 |
Through Sunday of week 6, Chicago has run nearly 20 more plays a game than Tennessee. San Francisco, one of three unbeaten teams with Kansas City and Minnesota, is second from the bottom, while Chicago at the top is 4-2: as the section above showed, play counts and winning have little to do with each other. Six games is a small sample, and a team that has had its bye has played only five. The standings have every team's record.
How Long a Game Takes
The play-by-play stamps each play with the time of day, so the real length of a game can be measured directly: from the opening kickoff to the end of the final play. In 2025 the median game took 3 hours 2 minutes, and the middle 80% ran from 2 hours 49 minutes to 3 hours 18 minutes. Games settled in regulation took a median 3 hours 1 minute; the 14 that went to overtime took 3 hours 29 minutes. That is roughly one play every 71 seconds of real time.
The 2026 games have run longer so far, a median of 3 hours 8 minutes across 91 games, against 3 hours 2 minutes for the first six weeks of 2025. Two games interrupted by lightning in 2025, and one in 2026, are left out of these figures.
What This Page Does Not Show
- Individual snap counts. How often a given player is on the field is a different measure; see the snap counts page.
- Why 2026 is running more plays. The page measures the change; it does not test a cause.
- Broadcast length. The game length here starts at the opening kickoff, not when a broadcast begins.
- Postseason games. Every figure is from the regular season.
Method and Sources
offensive play = a play flagged pass or rush with an expected-points value (the nflfastR convention): passes, sacks,
                 scrambles, designed runs and two-point tries, including snapped plays a penalty erased;
                 kneel-downs, spikes and fouls before the snap are not counted
per team       = offensive plays / (games x 2); 2002-2025 regular seasons, 2026 through October 18 (92 games)
kinds of play  = the play-type field of the 2025 play-by-play, every regular-season game (272)
game length    = opening kickoff to the end of the last play, from the time-of-day stamps; games with a weather
                 suspension left out (270 games in 2025, 91 in 2026)
more plays won = games where one team ran more offensive plays and the game did not end tied (6,032)
The script make_plays_per_game_chart.py checks the frozen files against their recorded hashes, rebuilds the 2025 count from the play-by-play and matches it to the 2002-2025 table, counts every kind of play, measures the game lengths, draws the exhibit and asserts every number on this page.
Sources: nflverse play-by-play releases for 2002-2025, and the 2025 and 2026 files pulled 9:38 am ET on October 19, 2026, with the nflverse game log for scores. The 2026 figures are through the Sunday games of October 18.
Further reading
- Snap Counts and Usage: how individual players' playing time is measured
- PROE and Game Script: why the score changes what an offense calls
- Points per Drive: what offenses get out of their possessions
- Explosive Plays: the few plays that decide many games
- 2026 NFL Standings: updated every game day
Go deeper
Want the code behind these metrics? Work through the 43-chapter NFL analytics tutorial.
Browse tutorials Free tools