How do you work out the distance of a field goal?
Take the yards from the line of scrimmage to the goal line and add 18: 10 yards of end zone, because the goalposts stand at the back of it, and about 8 yards from the line of scrimmage back to the spot of the hold. A try from the opponent's 30 is a 48-yard kick. In the play-by-play from 2006 to 2025, that sum is exact on 89.5% of tries, and almost all the rest are a yard either way. In 2025 kickers made 98.1% of tries under 30 yards, 84.3% from 40-49, 72.4% from 50-54 and 12 of 22 from 60 or more.
Related: fourth-down decisions · special teams
Figures from nflverse play-by-play: every regular-season field-goal try from 2006 to 2025, and the 93 games of 2026 through Monday, October 19, read October 20, 2026.
The Distance, Yard Line by Yard Line
kick distance = yards from the line of scrimmage to the goal line + 18Of the 20,072 regular-season tries from 2006 to 2025, 89.5% are listed at exactly 18 yards more than the line of scrimmage, 7.3% at 19 and 3.1% at 17. The extra yard has become more common lately: in 2025 it was 18 on 87.9% of tries and 19 on 11.1%. For working out a kick before the snap, 18 is the number to use.
This table turns a line of scrimmage into a kick and shows how often kicks of about that length went in over the last five seasons, counting every try within two yards of it.
| Line of scrimmage | Kick distance | Made, 2021-2025 (within 2 yards) | Tries |
|---|---|---|---|
| Opponent's 5 | 23 yards | 98.9% | 561 |
| Opponent's 10 | 28 yards | 97.2% | 685 |
| Opponent's 15 | 33 yards | 94.8% | 746 |
| Opponent's 20 | 38 yards | 90.5% | 754 |
| Opponent's 25 | 43 yards | 81.1% | 767 |
| Opponent's 30 | 48 yards | 75.8% | 737 |
| Opponent's 35 | 53 yards | 71.5% | 733 |
| Opponent's 40 | 58 yards | 62.0% | 255 |
| Opponent's 45 | 63 yards | 43.9% | 41 |
The fall is gentle inside the 20 and steep after it. From the 20 to the 25, five yards of field cost about nine points of make rate, and from the 35 to the 40 about ten more. Few teams try from the 40 or beyond, so those two rows rest on far fewer kicks. Whether a try is the right call at all is a separate question, worked through on the fourth-down page and the fourth-down calculator.
The Exhibit
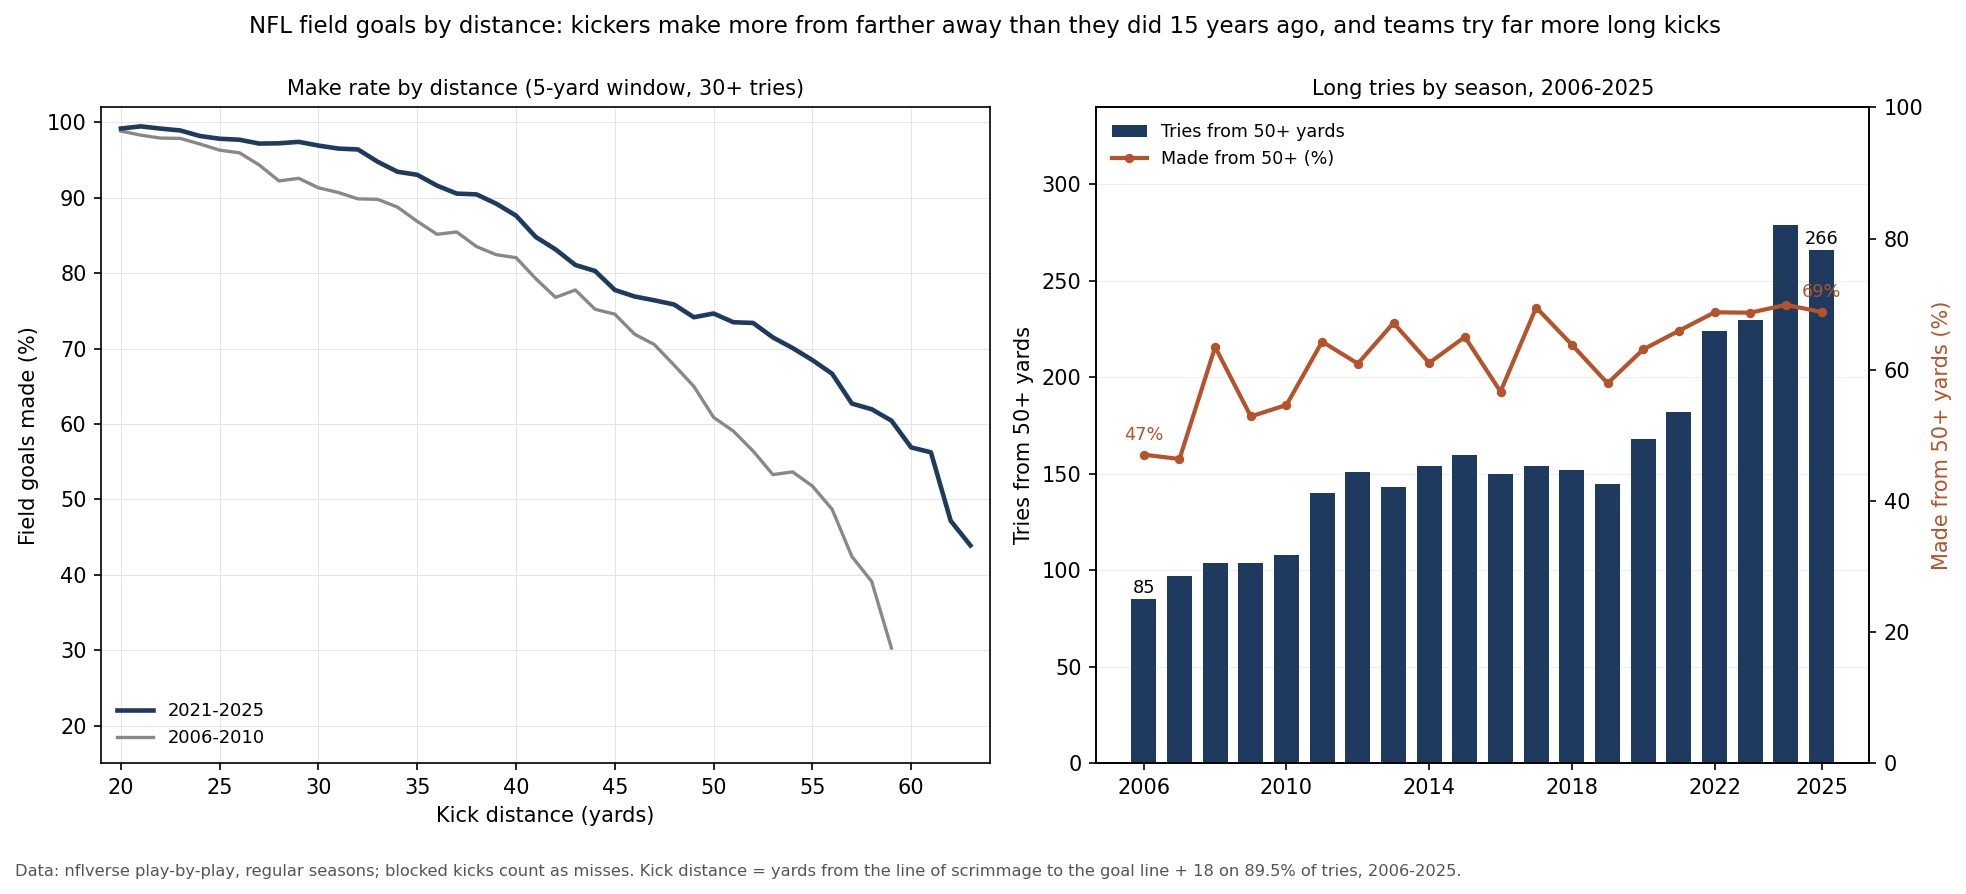
How Often Kicks Go In, Then and Now
| Kick distance | 2025 | 2021-2025 | 2006-2010 |
|---|---|---|---|
| Under 30 | 98.1% (210) | 98.0% (1,174) | 96.3% (1,431) |
| 30-39 | 93.0% (299) | 93.4% (1,497) | 87.6% (1,450) |
| 40-49 | 84.3% (313) | 79.8% (1,500) | 73.7% (1,417) |
| 50-54 | 72.4% (152) | 73.4% (767) | 56.4% (413) |
| 55-59 | 66.3% (92) | 62.7% (346) | 42.4% (66) |
| 60+ | 54.5% (22) | 44.1% (68) | 21.1% (19) |
Share made, with the number of tries in brackets. Blocked kicks count as misses; there were 23 in 2025, 2.1% of 1,088 tries. Any one season is a small sample beyond 50 yards, which is why the five-year column is the steadier guide.
Kickers now make long kicks far more often than they did. From 50 to 54 yards the make rate rose from 56.4% in 2006-2010 to 73.4% in 2021-2025, and from 60 or more from 4 of 19 to 30 of 68. Teams have answered by trying many more of them: 85 tries from 50 or more yards in 2006, 279 in 2024 and 266 in 2025, from about 0.3 a game to about 1.0 a game, while the share made rose from 47.1% to 68.8%. The average try grew from 36.0 yards in 2006 to 40.5 in 2025, the longest of the 20 seasons, and the overall make rate still went up, from 81.4% to 85.6%; the high was 86.5% in 2013.
The longest makes in the play-by-play since 2006 are all recent. All five makes of 65 yards or more came in 2021 or later. Cam Little of Jacksonville made a 68-yarder on the road against the Raiders on November 2, 2025, and a 67-yarder at home against Tennessee on January 4, 2026, in week 18 of that season; Justin Tucker's 66-yarder for Baltimore at Detroit on September 26, 2021, is third.
Indoors and Outdoors
Over 2021-2025, kicks under a dome or a closed roof went in more often than kicks outdoors or under an open roof, but not at every length. From 40 to 49 yards it was 83.7% indoors against 77.7% outdoors. From 50 to 54 it was nearly even, 74.0% against 73.1%. From 55 or more the gap was widest: 111 of 165 indoors (67.3%) against 136 of 249 outdoors (54.6%).
Treat that as a description, not a measured effect of the roof. Teams choose when to try a long kick, and the conditions on the day, the kicker and the score all shape which kicks get tried in the first place.
2026 So Far
Through Monday night of week 6, kickers have made 334 of 390 tries in 93 games, 85.6%, against 83.8% on 390 tries in 92 games over the first six weeks of 2025. There have been 109 tries from 50 or more yards, 77 of them good (70.6%), against 108 at the same point last season, and 4 of 8 from 60 or more. The average try is 41.5 yards, against 41.4 a year ago. The longest make is Tyler Loop's 64-yarder for Baltimore against Tennessee on October 4; the longest try is a 70-yarder by Cam Little that missed.
What This Page Does Not Show
- Individual kickers. The rates are league-wide; one kicker's season is too few long kicks to judge on its own.
- Wind and temperature. The roof comparison is as far as this page goes on conditions.
- Extra points. Only field-goal tries are counted.
- Postseason games. Every figure is from the regular season.
Method and Sources
try           = a regular-season play flagged as a field-goal attempt; made, missed or blocked (blocked = a miss)
kick distance = the distance listed in the play-by-play; line of scrimmage = yards to the goal line at the snap
yard-line table = 2021-2025 tries within 2 yards of line + 18
indoors       = dome or closed roof; outdoors = open-air stadiums and open retractable roofs
2026          = the 93 games through Monday, October 19
The script make_field_goal_distance_chart.py checks the frozen files against their recorded hashes, rebuilds every figure above from the play-by-play, draws the exhibit and asserts each number on this page.
Sources: nflverse play-by-play releases for 2006-2026 and the nflverse players file, pulled 9:09 pm ET on October 20, 2026, with the nflverse game log for scores. The 2026 figures are through Monday night of week 6.
Further reading
- Fourth-Down Decisions: when to kick, punt or go for it
- Fourth-Down Calculator: try the choice for any down, distance and field position
- Special Teams: how kicking and punting are valued
- Expected Points: what every spot on the field is worth
- Red Zone Efficiency: touchdowns against field goals inside the 20
Go deeper
Want the code behind these metrics? Work through the 43-chapter NFL analytics tutorial.
Browse tutorials Free tools