What is aDOT in football?
aDOT stands for average depth of target: the average distance past the line of scrimmage that a player's targets travel in the air, caught or not. It is air yards divided by targets, for a receiver or for a quarterback. In the 2025 regular season the league's aDOT was 7.86 yards. Wide receivers averaged 11.0, tight ends 6.2, and running backs about zero, because nearly half of their targets were thrown behind the line. Among quarterbacks with 250 or more targets the range ran from 6.2 to 9.3 yards.
Related: air yards and YAC · target share and WOPR
Figures from nflverse play-by-play: every regular-season target since 2009, and the 93 games of 2026 through Monday, October 19, read October 20, 2026.
How aDOT Is Calculated
Air yards measure how far the ball travels past the line of scrimmage to the point where it is caught, or where the receiver was when it fell incomplete. A pass caught 12 yards downfield is 12 air yards. A screen caught 3 yards behind the line is minus 3. The formula is short:
aDOT = total air yards on a player's targets / number of targetsTake a receiver with three targets in a game: a 25-yard throw that falls incomplete, a 6-yard catch and a screen caught 2 yards behind the line. His air yards are 25 + 6 - 2 = 29, and his aDOT is 29 / 3 = 9.7. The incompletion counts in full. That is the point of the stat: it describes where a player is being thrown to, not what he did after the catch. Yards after the catch are a separate number, explained on the air yards and YAC page.
For a quarterback, aDOT is the same average over every target he threw. Sacks, spikes and passes with no listed receiver are not targets, so they are left out; in 2025 that last group was 4.3% of pass attempts.
The Exhibit
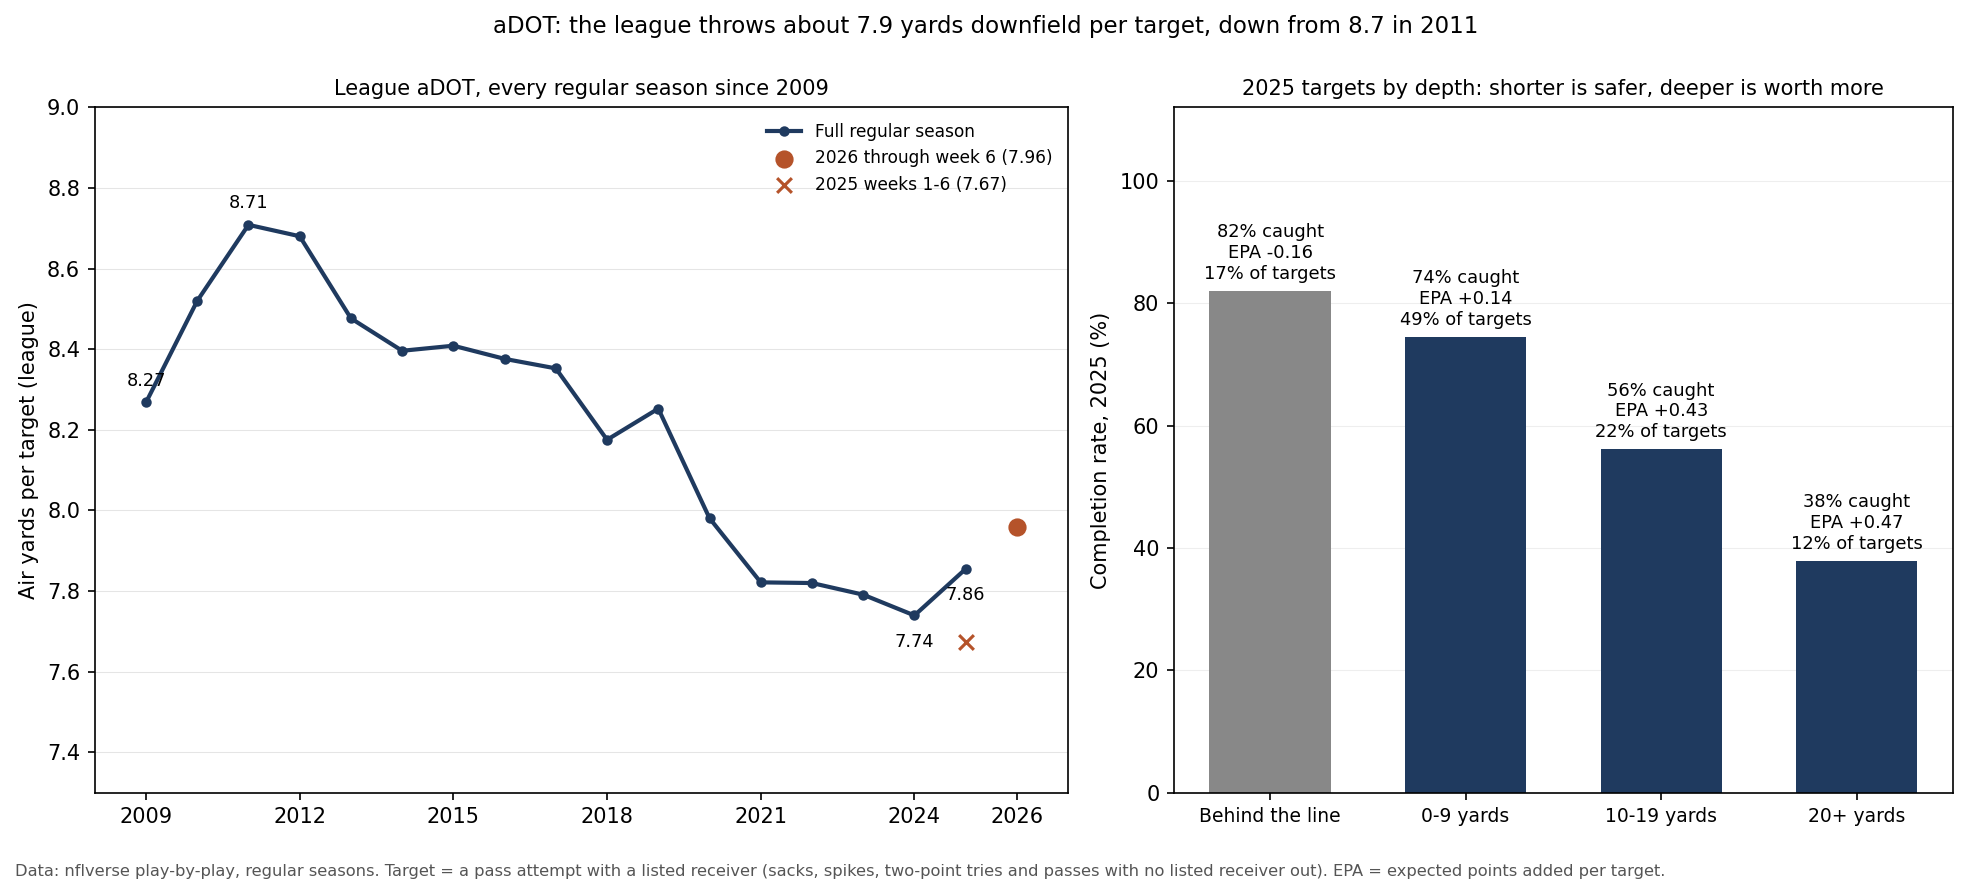
What Depth Buys, and What It Costs
The median 2025 target was caught or aimed 5 yards downfield, and most targets were short. Deeper throws are caught less often and picked off more often, but they gain more when they work.
| Depth of target, 2025 | Share of targets | Completion rate | Yards per target | EPA per target | Interception rate |
|---|---|---|---|---|---|
| Behind the line | 17.5% | 81.9% | 4.6 | -0.16 | 0.9% |
| 0-9 yards | 49.4% | 74.4% | 6.1 | +0.14 | 1.6% |
| 10-19 yards | 21.5% | 56.1% | 9.7 | +0.43 | 3.4% |
| 20+ yards | 11.7% | 37.9% | 12.4 | +0.47 | 4.9% |
EPA is expected points added, the change in a drive's scoring outlook on the play. Throws behind the line were the safest and the least productive, with a negative EPA on average even though 81.9% were caught. Targets of 10 yards or more were worth roughly three times as much per throw as the 0-9 group, at the price of more than twice the interception rate. This is why a high aDOT and a high completion rate pull against each other, and why completion rate alone says little about a passer; CPOE adjusts for exactly this.
Quarterback aDOT
Thirty quarterbacks threw at least 250 targets in 2025. These are the five shortest and the five deepest.
| Quarterback | Team | Targets | aDOT | Completion rate | EPA per target |
|---|---|---|---|---|---|
| Aaron Rodgers | PIT | 472 | 6.2 | 69.3% | 0.17 |
| Geno Smith | LV | 428 | 6.4 | 70.6% | 0.10 |
| Bryce Young | CAR | 444 | 6.6 | 68.5% | 0.13 |
| Jared Goff | DET | 546 | 6.7 | 72.0% | 0.37 |
| Tua Tagovailoa | MIA | 369 | 6.9 | 70.5% | 0.18 |
| Trevor Lawrence | JAX | 544 | 9.0 | 62.7% | 0.20 |
| Jalen Hurts | PHI | 427 | 9.0 | 68.9% | 0.23 |
| Lamar Jackson | BAL | 290 | 9.0 | 66.2% | 0.28 |
| Drake Maye | NE | 472 | 9.2 | 75.0% | 0.52 |
| Matthew Stafford | LA | 581 | 9.3 | 66.8% | 0.34 |
A short aDOT is a style, not a verdict. Jared Goff had the fourth-shortest aDOT of the 30 and the third-best EPA per target, 0.37. Drake Maye combined a deep aDOT with a 75.0% completion rate and led the group at 0.52. Across all 30, a deeper aDOT went with a better EPA per target (correlation 0.42) and a slightly lower completion rate (-0.23).
That 2025 link was unusually strong. In each season since 2009 the correlation between a quarterback's aDOT and his EPA per target was positive 14 times in 17, but the median was only 0.14; 2025's 0.42 was the highest, just ahead of 2023. Pool all 530 quarterback seasons of 250 or more targets and it falls to 0.08. Depth helps on average, but how well the throws land matters far more.
Quarterback aDOT also moves from year to year. For the 368 cases of a passer with 250 or more targets in two straight seasons, the correlation between one season's aDOT and the next was 0.48, lower than for completion rate (0.65). The play-caller, the receivers and the score all feed into it. Through week 6 of 2026, Patrick Mahomes is at 6.6 after 8.2 last season, Bryce Young at 9.4 after 6.6, and Bo Nix at 5.6, the shortest of the 28 passers with 100 or more targets, after 7.5. Malik Willis of Miami is the deepest at 10.4.
Receiver aDOT: a Description of the Job
For receivers, aDOT mostly tells you the role. In 2025 wide receivers averaged 11.0 yards on 9,590 targets and caught 62.3%; tight ends 6.2 on 3,968 and caught 72.3%; running backs, fullbacks included, -0.03 on 2,982 and caught 78.1%, with 48.6% of their targets thrown behind the line.
| Deepest, 2025 (80+ targets) | aDOT | Caught | Shortest, 2025 (80+ targets) | aDOT | Caught |
|---|---|---|---|---|---|
| Alec Pierce, IND | 19.0 | 56.0% | Kenny Gainwell, PIT | -0.2 | 85.9% |
| Brian Thomas Jr., JAX | 14.5 | 52.7% | De'Von Achane, MIA | 0.4 | 78.8% |
| Rome Odunze, CHI | 13.9 | 48.9% | Chase Brown, CIN | 0.5 | 78.4% |
| Tee Higgins, CIN | 13.4 | 60.2% | Jahmyr Gibbs, DET | 0.6 | 81.9% |
| Jaylen Waddle, MIA | 13.1 | 64.0% | Bijan Robinson, ATL | 1.0 | 76.7% |
Alec Pierce was in a class of his own at 19.0, 4.5 yards deeper than anyone else with 80 targets. The five shortest were all running backs. Among the 44 wide receivers with 80 or more targets, a deeper aDOT went with a lower catch rate (correlation -0.63), so a deep receiver's catch rate should be read against his depth before it is called a weakness.
Unlike quarterback aDOT, receiver aDOT barely moves. For the 1,378 cases of a receiver with 50 or more targets in two straight seasons, 2009-2025, the season-to-season correlation was 0.90, against 0.60 for catch rate and 0.65 for yards after the catch. A receiver's depth is set by where he lines up and the routes he runs, which is why it is one of the steadiest numbers in the passing game.
The League Is Throwing Shorter
League aDOT was 8.27 in 2009, peaked at 8.71 in 2011 and stayed between 8.2 and 8.7 through 2017. Since 2020 it has sat between 7.7 and 8.0, with a low of 7.74 in 2024 and 7.86 in 2025. The first six weeks of 2026 are at 7.96, against 7.67 at the same point of 2025, so the early 2026 passing game is throwing a little deeper than last season's did.
The series starts in 2009 on purpose. The play-by-play has air yards from 2006, but the league figure jumps by 1.8 yards between 2008 and 2009, when no other change from one season to the next reaches 0.35 yards. A step that size points to a change in how depth was recorded, not in how teams threw, so the earlier seasons are left out.
What This Page Does Not Show
- Why a quarterback's aDOT changed. Scheme, receivers, protection and the score all move it; the page measures the change, not the cause.
- Route-level detail. aDOT averages every target; it does not say which routes produced them. Opportunity per route is on the yards per route run page.
- Accuracy. Whether a throw was on target is not in this data; CPOE is the closest measure here.
- Postseason games. Every figure is from the regular season.
Method and Sources
target        = a regular-season pass attempt with a listed receiver and an air-yards value; sacks, spikes,
                two-point tries and passes with no listed receiver are not targets
aDOT          = air yards / targets (air yards are negative behind the line of scrimmage)
depth bands   = behind the line (air yards below 0), 0-9, 10-19 and 20+ yards; 16,609 targets in 2025
positions     = the nflverse players file, read October 20, 2026
qualifiers    = quarterbacks 250+ targets in a season; receivers 80+ (2025 tables) or 50+ (year-to-year)
2026          = the 93 games through Monday, October 19
The script make_adot_chart.py checks the frozen files against their recorded hashes, rebuilds every figure above from the play-by-play, draws the exhibit and asserts each number on this page.
Sources: nflverse play-by-play releases for 2006-2026 and the nflverse players file, pulled 9:09 pm ET on October 20, 2026, with the nflverse game log for scores. The 2026 figures are through Monday night of week 6.
Further reading
- Air Yards and YAC: how receiving yards split into the throw and the run after it
- Target Share and WOPR: how much of an offense a receiver commands
- YAC Over Expected: what a receiver adds after the catch
- CPOE: completion rate adjusted for how hard the throws were
- Yards per Route Run: receiving production per route
Go deeper
Want the code behind these metrics? Work through the 43-chapter NFL analytics tutorial.
Browse tutorials Free tools