What is Drive 1 in the NFL?
Drive 1 is the first possession of the game: the series of plays run by the team that receives the opening kickoff, from its first snap until it scores, gives the ball up or the half ends. Play-by-play data such as nflverse counts every possession in the game in one sequence, both teams together, so Drive 2 is usually the other team's first possession (in 96.0% of games since 2002). Where a drive chart numbers each team's possessions separately, Drive 1 is that team's own first possession. In 2025 the opening drive ended in points 45.6% of the time, the highest share of any season since 2002, and a team that scored a touchdown on Drive 1 won 62.6% of those games over 2002-2025.
Related: points per drive · plays in an NFL game
Figures from nflverse play-by-play: every regular-season drive from 2002 to 2025, and the 93 games of 2026 through Monday, October 19, read October 21, 2026.
How Drives Are Counted
A drive is one team's possession. It starts when a team gets the ball, from a kickoff, a punt, a turnover, a missed field goal or a stop on fourth down, and it ends when that team scores, gives the ball up or runs out of time in the half. The numbering does not restart for each team. If the home team receives the opening kickoff and punts, the visitors' first possession is Drive 2, the home team's second is Drive 3, and so on.
That is why drive numbers usually alternate between the two teams, but not always. When a drive ends in a touchdown by the defense, such as an interception returned for a score, the team that lost the ball gets it back on the next kickoff and has two numbered drives in a row. Across 2002-2025, Drive 2 belonged to the team that did not have Drive 1 in 96.0% of games.
In 2025 there were 5,744 drives in 272 games, 21.1 a game or about 10.6 for each team. That is the fewest a game of any season since 2002, when there were 23.7. Fewer possessions go with fewer plays, a trend laid out on the plays-per-game page.
How NFL Drives End
Every drive in the play-by-play is listed with how it ended. A third of 2025 drives ended in a punt, and 39.3% ended in points: a touchdown on 23.1% and a field goal on 16.2%.
| How the drive ended | 2025 drives | Share, 2025 | Share, 2002-2025 | Drive 1 only, 2002-2025 |
|---|---|---|---|---|
| Punt | 1,916 | 33.4% | 38.8% | 49.1% |
| Touchdown | 1,329 | 23.1% | 20.3% | 21.4% |
| Field goal | 931 | 16.2% | 13.8% | 13.5% |
| Turnover (interception or lost fumble) | 550 | 9.6% | 11.2% | 9.7% |
| End of half or game | 424 | 7.4% | 7.2% | 0.0% |
| Turnover on downs | 362 | 6.3% | 4.2% | 2.2% |
| Missed field goal | 154 | 2.7% | 2.7% | 2.5% |
| Touchdown by the other team | 66 | 1.1% | 1.5% | 1.4% |
| Safety | 12 | 0.2% | 0.3% | 0.1% |
The share of drives ending in points has climbed from 31.1% in 2002 to 39.3% in 2025, with the high at 39.6% in 2020. Turnovers on downs rose from 3.6% of drives in 2002 to 6.3% in 2025; the fourth-down page works through when going for it pays. The points-per-drive page explains why the drive is the right unit for judging an offense.
Drive 1 by the Numbers
Across the 6,223 regular-season games from 2002 to 2025, the opening drive ended in points 35.0% of the time: a touchdown on 21.4% and a field goal on 13.5%. It ended in a punt on 49.1%, far more than the average drive, partly because an opening drive never runs out of time at the end of a half.
The opening drive scores about as often as the first drive of the second half, which ended in points 35.1% of the time over the same seasons, and more often than the average drive that starts with a kickoff (31.9%). Both of those drives start with a kickoff and a full quarter on the clock, and the numbers do not show the opener as special beyond that.
2025 was the best season for opening drives since 2002: 124 of 272 scored, 73 with a touchdown and 51 with a field goal, for 45.6%. The next best was 2022 at 42.4%. The second-half opener also scored 44.5% of the time in 2025.
Where Drive 1 Starts
The first snap of the opening drive has moved up the field in steps. From 2002 to 2010 the median opening drive started between the offense's own 24 and own 28, depending on the season. From 2011 to 2015 the median was the own 20, from 2016 to 2023 the own 25, in 2024 the own 30 and in 2025 the own 31. In 2026 through week 6 it is the own 30. Each step lines up with a change to the kickoff rules, and the opening drives of 2024 and 2025 had the best median starting spots of any full seasons here.
The Exhibit
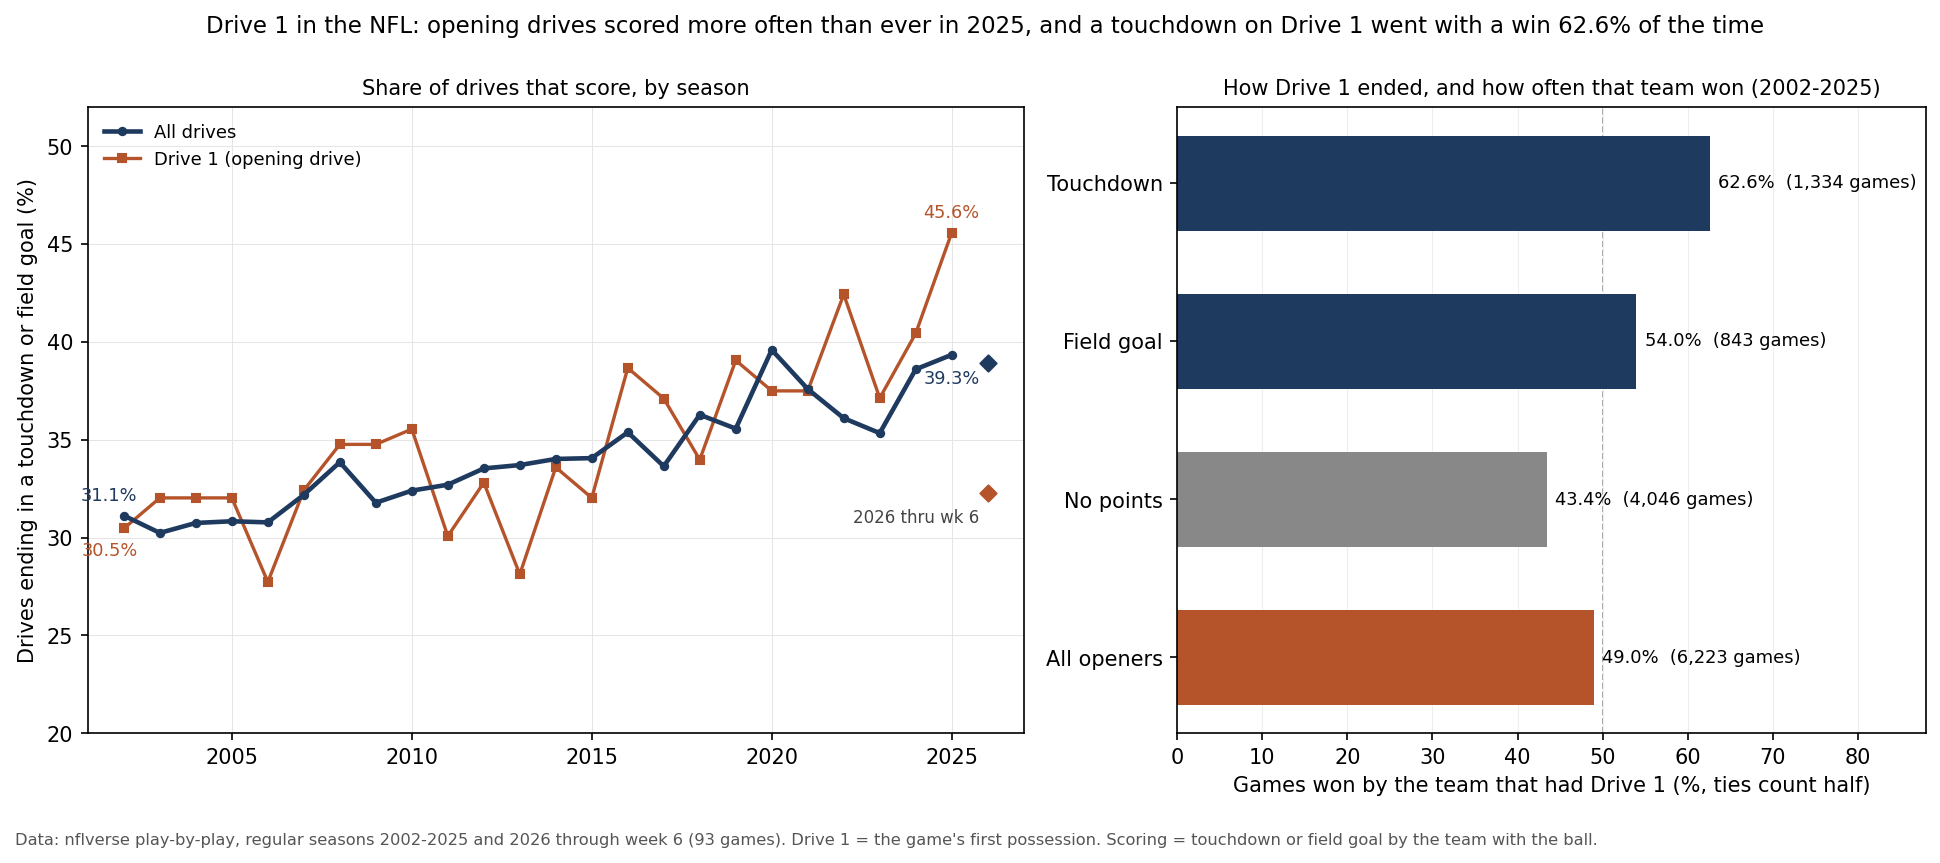
Does Scoring on Drive 1 Mean Winning?
| How Drive 1 ended, 2002-2025 | Games | Won-lost-tied | Won |
|---|---|---|---|
| Touchdown | 1,334 | 833-497-4 | 62.6% |
| Field goal | 843 | 455-388-0 | 54.0% |
| No points | 4,046 | 1,752-2,283-11 | 43.4% |
| Every opening drive | 6,223 | 3,040-3,168-15 | 49.0% |
A touchdown on the first drive went with a win in 62.6% of games, a field goal in 54.0%, and no points in 43.4%. In the 87 games where Drive 1 ended in a touchdown for the other team, the team that started with the ball went 28-59. Having the ball first is no edge by itself: the team that received the opening kickoff won 49.0% of the time.
Read the table as a description, not a cause. A touchdown in the first few minutes is worth something on the scoreboard, but the teams that score on their first drive are also, on average, the better teams on the day, and the table cannot separate the two. The win probability page shows how much any single score changes a game.
2026 So Far
Through Monday night of week 6, 30 of 93 opening drives have ended in points, 32.3%: 18 touchdowns and 12 field goals, with 48 punts. That is well below 2025's 45.6%, while drives as a whole are scoring at close to last season's rate, 38.9% against 39.3%. Games are averaging 21.9 drives, against 21.1 in 2025. Six weeks is a small sample for opening drives alone, so expect the 2026 figure to move.
What This Page Does Not Show
- The coin toss. The play-by-play records which team received the opening kickoff, not which team won the toss or chose to defer.
- Individual teams. Every figure is league-wide; one team's opening drives in one season are too few to judge on their own.
- Overtime rules. Overtime possessions are counted in the drive totals but not studied separately here.
- Postseason games. Every figure is from the regular season.
Method and Sources
drive         = one possession in the nflverse play-by-play (one row per game and drive number)
Drive 1       = the first possession of each game, the team that received the opening kickoff
scored        = the drive ended in a touchdown or a field goal for the team with the ball
start         = the yard line of the drive's first snap; median by season
won           = final score from the nflverse game log, ties counted as half a win
2026          = the 93 games through Monday, October 19
The script make_drive_1_chart.py checks the frozen files against their recorded hashes, rebuilds every figure above from the play-by-play, draws the exhibit and asserts each number on this page. Twenty-one rows from 2002-2026 with no listed result, nearly all single plays split off from a drive, are left out.
Sources: nflverse play-by-play releases for 2002-2026, pulled 11:08 am ET on October 21, 2026, with the nflverse game log for final scores. The 2026 figures are through Monday night of week 6.
Further reading
- Points Per Drive: why the drive is the unit to judge an offense by
- How Many Plays Are in an NFL Game: snaps, kicks and time
- Fourth-Down Decisions: when to kick, punt or go for it
- Red Zone Efficiency: touchdowns against field goals inside the 20
- Time of Possession: what holding the ball does and does not tell you
Go deeper
Want the code behind these metrics? Work through the 43-chapter NFL analytics tutorial.
Browse tutorials Free tools