What is the toughest NFL division in 2026?
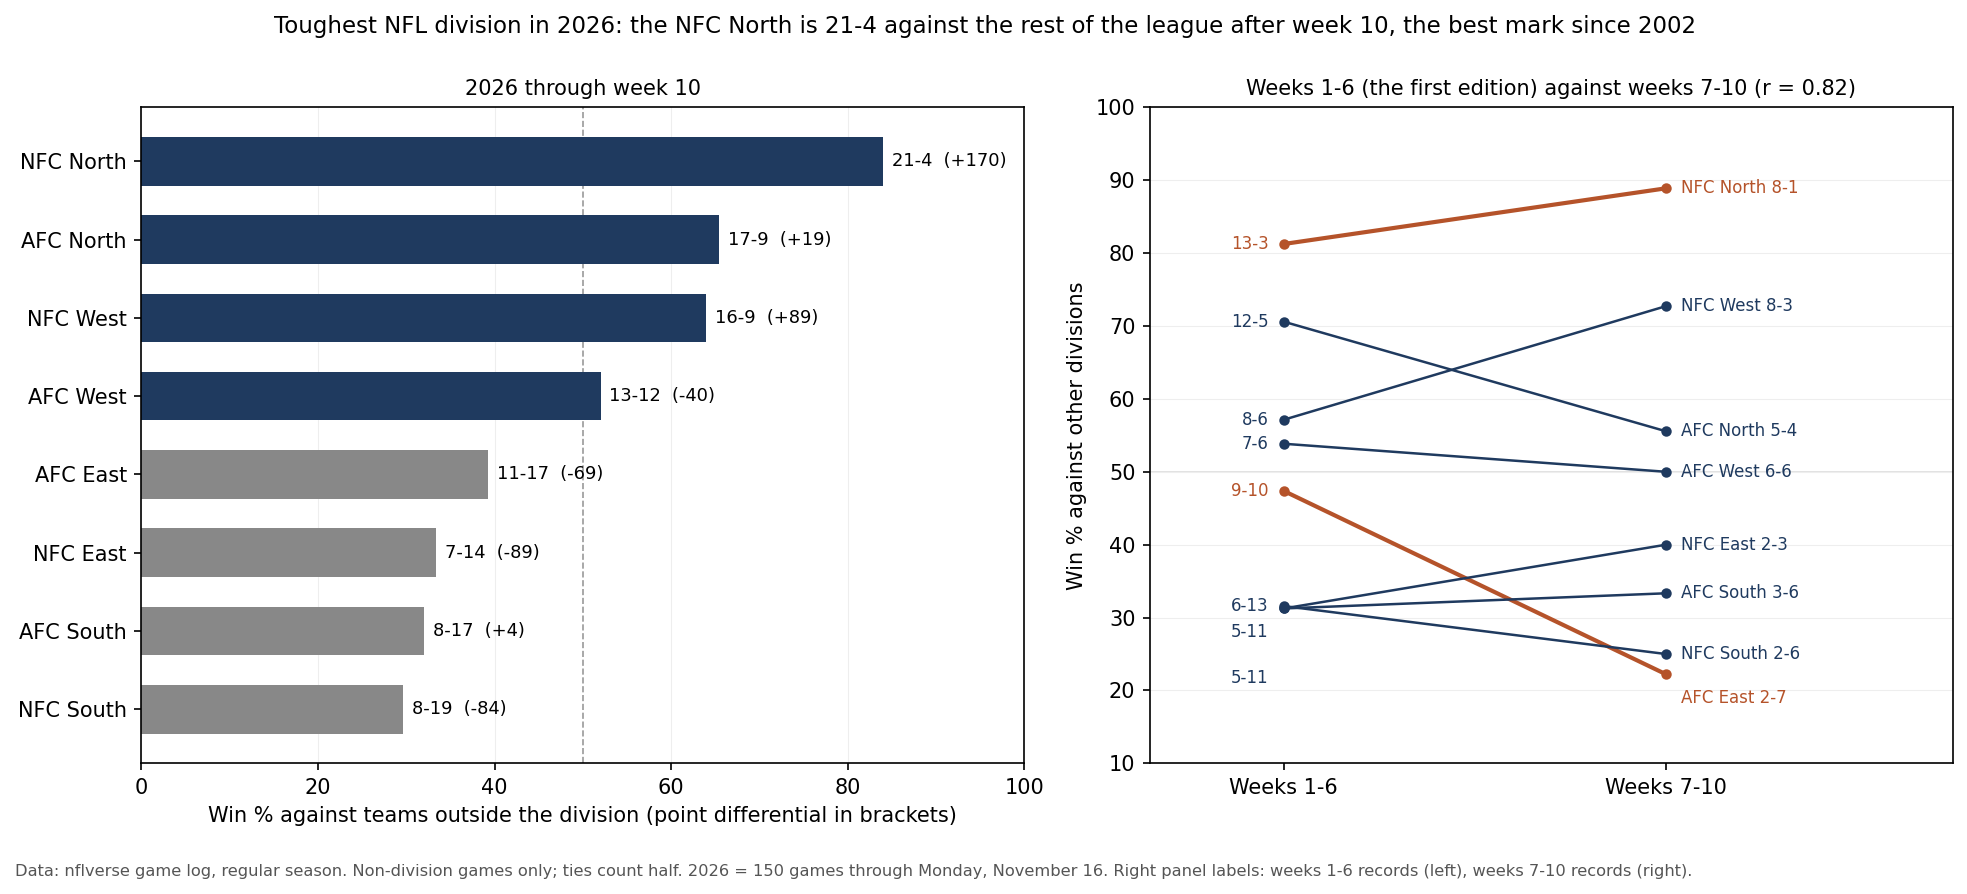
Through week 10 it is still the NFC North. Its teams are 21-4 against teams from other divisions, a .840 rate, and have outscored them by 170 points; Chicago, Detroit and Minnesota are 7-2 and Green Bay 6-4. No division since 2002 had a better record against the rest of the league after ten weeks. The AFC North is second at 17-9, but it has had the easiest outside schedule of the eight. The NFC South is last at 8-19, against the hardest.
Related: NFL standings 2026 · NFL power rankings · playoff picker
Figures from the nflverse game log: the 150 games of 2026 through Monday, November 16 (all of week 10), read November 17, 2026, and every regular-season game from 2002 to 2025. First published October 21 through week 6; the week-6 table is compared below.
How to Measure Division Strength
A division's combined record is a poor guide to how good it is. Every game between two division rivals adds one win and one loss to the same division, so those games pull every division's total toward .500 no matter how strong its teams are. The NFC East's combined 14-21-2 includes a 27-27 tie between the Giants and Washington on October 11 that counts twice, once for each team.
The fair test is the games against everyone else. This page ranks the eight divisions by their record in games against teams from other divisions, with ties counted as half a win. Point differential needs no such filter: in a division game one rival's margin is the other's deficit, so a division's total point differential is exactly its differential against the rest of the league.
Two more columns help read the records. Power rating is the average of the four teams' ratings in our power rankings, in points per game better or worse than an average team on a neutral field; it adjusts for who each team has played. Opponents' win % is the combined record of the outside teams a division has played, counted once per game, so it says how hard the games behind the record were.
NFL Division Strength 2026, Ranked Through Week 10
| Division | Vs other divisions | Win % | Point diff. | Vs other conference | Combined | Power rating | Opponents' win % |
|---|---|---|---|---|---|---|---|
| NFC North | 21-4 | .840 | +170 | 9-2 | 27-10 | +3.28 | .380 |
| AFC North | 17-9 | .654 | +19 | 9-2 | 23-15 | -0.09 | .364 |
| NFC West | 16-9 | .640 | +89 | 10-4 | 23-16 | +2.31 | .485 |
| AFC West | 13-12 | .520 | -40 | 6-8 | 19-18 | -0.42 | .492 |
| AFC East | 11-17 | .393 | -69 | 3-10 | 16-22 | -1.02 | .593 |
| NFC East | 7-14 | .333 | -89 | 5-3 | 14-21-2 | -1.98 | .472 |
| AFC South | 8-17 | .320 | +4 | 2-6 | 14-23 | -0.01 | .517 |
| NFC South | 8-19 | .296 | -84 | 2-11 | 13-24 | -2.08 | .642 |
The NFC North is the only division with no team below .500, and it leads on every measure: record, point differential and power rating. The two other columns split the next places. The AFC North is second on record, but its outside opponents have won only .364 of their games, the weakest slate of the eight, and its teams average about a typical team on the power rating (-0.09); Baltimore is 4-6. The NFC West is a game behind on record with a far better point differential (+89) and the second-best power rating (+2.31), from San Francisco at 8-1 and the Rams and Seattle at 6-4. The AFC South's rating (-0.01) is close to average only because of Jacksonville; its other three teams are 7-21. Between the conferences the NFC leads 26-20.
Power ratings as published on our power rankings page on November 17, 2026, through week 10, like every other column. Every team's record and the division races are on the standings page, and the games-behind page measures how safe each division lead is.
Four Weeks Later: How the Week-6 Table Held Up
This page first ranked the divisions on October 21, after week 6. Splitting the season at that point shows whether the early table was a fluke. The table below sets each division's record against other divisions in weeks 1-6 beside its record in weeks 7-10.
| Division | Rank after week 6 | Weeks 1-6 | Weeks 7-10 | Rank in weeks 7-10 | Rank after week 10 |
|---|---|---|---|---|---|
| NFC North | 1 | 13-3 | 8-1 | 1 | 1 |
| AFC North | 2 | 12-5 | 5-4 | 3 | 2 |
| NFC West | 3 | 8-6 | 8-3 | 2 | 3 |
| AFC West | 4 | 7-6 | 6-6 | 4 | 4 |
| AFC East | 5 | 9-10 | 2-7 | 8 | 5 |
| NFC South | 6 | 6-13 | 2-6 | 7 | 8 |
| AFC South | 7 | 5-11 | 3-6 | 6 | 7 |
| NFC East | 8 | 5-11 | 2-3 | 5 | 6 |
The top four held their places. The NFC North went 8-1 against other divisions in weeks 7-10, the best of any division in that span, so its lead grew rather than faded. The NFC West was the second-best division of the span at 8-3. Below them the order shuffled: the AFC East went 2-7, the worst mark of the four weeks, and held fifth only because of its 9-10 start; the NFC South went 2-6 and fell from sixth to last; the NFC East, last after week 6, went 2-3 and rose to sixth. Across the eight divisions the two spans line up closely (a correlation of 0.82 between the weeks 1-6 and weeks 7-10 win rates), so the early table was a fair guide to the next four weeks.
Who They Have Played
The schedule shapes these numbers. Each season every division plays every team in one other division of its own conference and one division of the other conference. In 2026 the NFC North draws the NFC South and the AFC East, and the AFC North draws the AFC South and the NFC South. So far the NFC North is 8-2 against the NFC South and 8-2 against the AFC East, and 5-0 against everyone else. The AFC North is 8-2 against the NFC South and 7-3 against the AFC South, but 2-4 against the other divisions it has met.
That puts the NFC South at the center of both ends of the table: it is 4-16 against the two Norths and 4-3 against everyone else, and its outside opponents have won .642 of their games, the hardest slate in the league. The Norths have beaten the teams on their schedule, which is what the record measures; the opponents' win % column shows how hard those games were, and the power rating adjusts for it: the NFC North leads that column too, while the AFC North drops to fourth. The strength of schedule page explains how opponent quality is usually measured.
The Exhibit
What the Top Division After Week 10 Went On to Do
The eight-division league began in 2002, which gives 24 seasons and 192 division-seasons to compare. After ten weeks a division's record against the rest of the league is a strong guide to its final figure (a correlation of 0.89 across the 192), and the leader usually stays in front: the division on top after week 10 was still on top at the end of the season 15 times in 24 and in the top two 22 times. It averaged .686 against other divisions at that point and .633 by the end, and 22 of the 24 finished with a winning record against the rest of the league.
Being the strongest division has paid off in the regular season more than in the playoffs. The week-10 leader sent 2.25 teams to the playoffs on average (three teams 10 times, two 10 times, one 4 times), against 1.56 for all division-seasons, and it produced a conference's No. 1 seed in 15 of the 24 seasons, where a division picked at random would have done so about 6 times. But it supplied a Super Bowl team only 7 times, close to the 6 a random division would, and the champion 3 times: the 2002 Buccaneers, the 2021 Rams and the 2025 Seahawks. A deep division sends more teams into January; it does not send them further once they get there.
This year's NFC North, at .840, has the best record against the rest of the league after ten weeks of any division since 2002. The closest was the 2022 NFC East at 21-6 (.778), which finished 32-12 against other divisions, sent three teams to the playoffs and had both the NFC's No. 1 seed and a Super Bowl team. No. 1 seeds come from the standings with the league's tiebreakers applied, computed the same way as on our final-standings pages.
The Bottom of the Table
An 8-19 record against other divisions after ten weeks is weak but not historic: 7 of the 192 division-seasons since 2002 were lower at that point. The lowest was the 2020 NFC East at 2-18-1, which finished 11-28-1 against the rest of the league and still sent one team to the playoffs. Every division does, because each division winner gets a playoff place, so a weak division's race can still decide a seed: the NFC South leader is in playoff position at 4-5. How many wins a team usually needs is on the wins-to-make-the-playoffs page.
What This Page Does Not Show
- Equal games played. After byes, teams have played nine or ten games, so the divisions' totals rest on 21 to 28 games against other divisions.
- Projections. No forecast is used; the playoff chances for every team are on our playoff chances page.
- Postseason results for 2026. The history counts playoff teams, No. 1 seeds and Super Bowl teams in past seasons only.
Method and Sources
non-division game = a regular-season game between teams from different divisions (2026 alignment, unchanged since 2002)
win %             = (wins + ties / 2) / games, rounded half up
point diff.       = all points scored minus allowed; division games cancel out
power rating      = mean of the four teams' power ratings as published Nov 17, 2026 (through week 10)
opponents' win %  = combined record of the outside opponents played, one count per game
through week 10   = games in weeks 1-10; for 2026, the 150 games through Monday, November 16
top division      = best non-division win % after week 10, point differential breaking ties
No. 1 seed        = the league's tie-breaking procedure applied to the final standings
playoff teams     = teams that played at least one postseason game (12-team field through 2019, 14 since 2020)
team codes        = SD, STL and OAK counted with LAC, LA and LV
Our chart script checks the frozen game log, rebuilds every figure above, draws the exhibit and asserts each number on this page.
Sources: nflverse game log, pulled 12:23 am ET on November 17, 2026, for 2026 through Monday night of week 10, and the same game log for 2002-2025; power ratings from our power rankings as published the same day.
Further reading
- NFL Standings 2026: every division and both conferences
- NFL Power Rankings: all 32 teams by our own rating
- Division Standings 2026: Games Behind: how safe each division lead is
- The NFC West, Measured: one division's three strong teams at week 5
- AFC vs NFC: the conference series since 2002
- Playoff Picker: pick the remaining games and see the seeds
Your team
Kept in this browser only.
Pick the playoffs
Pick the games left and see both conferences’ seeds under the NFL’s tie-breakers.
Go deeper
Want the code behind these metrics? Work through the 43-chapter NFL analytics tutorial.
Browse tutorials Free tools