What do ATT, LNG and PCT mean in football stats?
ATT is attempts: pass attempts in a passing line, rushing attempts (carries) in a rushing line. LNG is the longest single gain: the longest completion, run, catch or made field goal. PCT is a percentage: completion percentage in a passing line, and in the standings the winning percentage, (W + T/2) / games, where a tie counts as half a win. Most box-score abbreviations are that simple, but a few carry a rule that changes the totals: sacks are not pass attempts, spikes are, kneel-downs count as runs, and a pass defended includes interceptions. Each is shown below on a real box score and on the 2025 season's totals.
Related: analytics glossary · passer rating formula · what YAC means
Figures from nflverse play-by-play, player game statistics and game log: the 2025 regular season, and the 93 games of 2026 through Monday, October 19, read October 22, 2026.
One Box Score, Read Line by Line
The example is a game with a little of everything: the New York Giants and Washington tied 27-27 on October 11, 2026, in week 5. Every line below was rebuilt play by play and matches the nflverse player statistics exactly.
Passing: CMP/ATT, YDS, TD, INT, SCK, LNG, Y/A, RTG
| Passer | Team | CMP/ATT | YDS | TD | INT | SCK-YDS | LNG | Y/A | RTG |
|---|---|---|---|---|---|---|---|---|---|
| Jameis Winston | NYG | 33/54 | 326 | 3 | 0 | 2-21 | 28 | 6.0 | 96.7 |
| Jayden Daniels | WAS | 17/25 | 199 | 0 | 0 | 5-23 | 25 | 8.0 | 91.9 |
Jameis Winston went 33/54 for 326 yards and 3 touchdowns: 33 completions (CMP) on 54 attempts (ATT), so his PCT, completion percentage, was 33 / 54 = 61.1%. Y/A, yards per attempt, was 326 / 54 = 6.0. His LNG of 28 was his longest completion. SCK-YDS reads sacks and the yards they cost: Winston was sacked twice for 21 yards. Those 21 yards are not taken off his 326, and the two sacks are not among his 54 attempts. Net yards per attempt (NY/A) puts them back in: (326 - 21) / (54 + 2) = 305 / 56 = 5.45. His passer rating (RTG) works out to 96.7; Jayden Daniels's 17/25 for 199 yards and no touchdowns rates 91.9. The arithmetic is on the passer rating formula page.
Rushing: ATT (or CAR), YDS, AVG, LNG, TD
| Rusher | Team | ATT | YDS | AVG | LNG | TD |
|---|---|---|---|---|---|---|
| Jayden Daniels | WAS | 9 | 103 | 11.4 | 38 | 2 |
| Jacory Croskey-Merritt | WAS | 11 | 82 | 7.5 | 33 | 1 |
| Cam Skattebo | NYG | 13 | 59 | 4.5 | 19 | 0 |
In a rushing line ATT means carries, which is why some box scores write CAR instead. AVG is yards per carry. Daniels's 9 rushing attempts for 103 yards include 7 scrambles and 1 kneel-down: a quarterback who drops back and runs is credited with a rush, not a pass attempt, and a kneel-down is a rush that loses ground.
Receiving: TGT, REC, YDS, AVG, LNG, TD
| Receiver | Team | TGT | REC | YDS | AVG | LNG | TD |
|---|---|---|---|---|---|---|---|
| Malik Nabers | NYG | 20 | 11 | 121 | 11.0 | 28 | 1 |
| Isaiah Likely | NYG | 13 | 11 | 94 | 8.5 | 17 | 2 |
| Terry McLaurin | WAS | 4 | 4 | 62 | 15.5 | 22 | 0 |
TGT, targets, counts the passes thrown to a player, caught or not; REC counts the catches. Malik Nabers was targeted 20 times and caught 11 for 121 yards, and his 28-yard LNG is the same play as Winston's. AVG here is yards per catch. Receiving yards include the yards gained after the catch, often abbreviated YAC.
Kicking and defense: FGM-FGA, XPM-XPA, SOLO, AST, SCK, TFL, QB HIT, PD
Dominic Zvada made field goals of 51 and 56 yards and missed from 50, 57 and 46, so his line reads 2-5 with a long of 56; he made all 3 extra points (XPM-XPA 3-3). Washington made 1 of 2 extra-point kicks and its one two-point try, which is how three touchdowns and two field goals came to 27 on both sides. On defense, Rasul Douglas of Washington led the game with 9 solo tackles and 1 assist, and Andru Phillips of the Giants had 5 solo tackles, 2 sacks, 2 tackles for loss and 4 QB hits.
The Rules Inside the Abbreviations
In 2025 the league's quarterbacks threw 17,439 passes, 79 of them spikes, and were sacked 1,287 times for 8,336 yards. Five conventions decide how plays like those are counted.
- A sack is not a pass attempt, and its yards stay out of the passer's YDS. They come off the team's net passing yards instead: the league's passing yards were 122,413 while its net passing yards were 114,077. League-wide Y/A in 2025 was 7.02 and NY/A 6.09. A team's net passing yards and its passers' combined YDS therefore differ by exactly its sack yards.
- A spike is a pass attempt. Throwing the ball into the ground to stop the clock counts as an incomplete pass: all 79 spikes of 2025 were, so they lower PCT and Y/A slightly.
- Kneel-downs and scrambles are runs. In 2025, 433 kneel-downs counted as runs for -459 yards (406 lost ground, the other 27 gained nothing), and 1,089 scrambles counted as runs. No sack is counted as a run.
- An interception is also a pass defended. In the 2025 data every one of the season's 380 interceptions also carried a pass-defended credit, so the 2,357 passes defended include them.
- Sacks can be split. When two defenders share a sack each is credited with half. In 2025, 1,123 sacks went to one player, 155 were shared as half sacks, and 9 were credited to no one, so defenders were credited with 1,278 of the 1,287 sacks.
The Exhibit
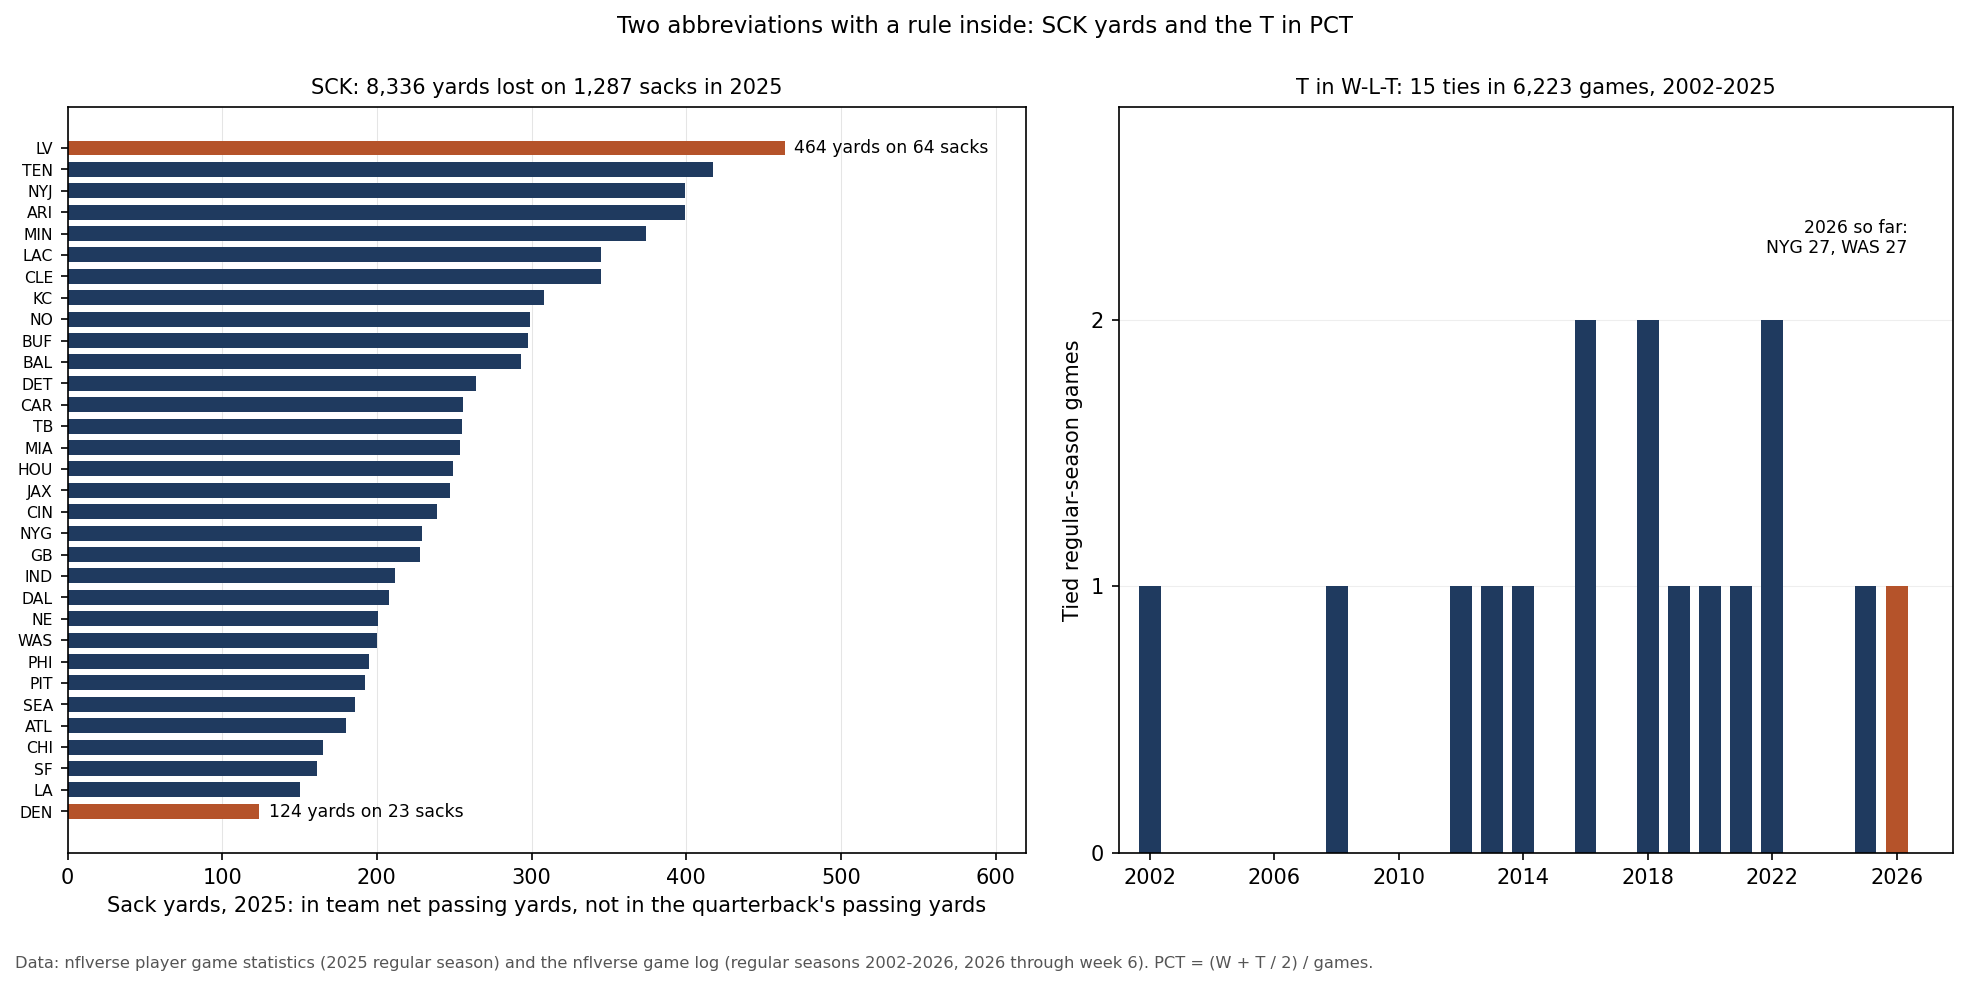
The Raiders lost the most, 464 yards on 64 sacks; the Broncos the fewest, 124 on 23. For a team that is sacked often, the quarterback's passing yards overstate what the passing game gained.
Reference: Box-Score Abbreviations With 2025 Totals
| Abbreviation | Stands for | What to know | 2025 league total |
|---|---|---|---|
| ATT | Pass attempts | Spikes in, sacks out | 17,439 |
| CMP | Completions | Equal to receptions league-wide | 11,217 |
| YDS | Passing yards | Gross: sack yards not subtracted; equal to receiving yards | 122,413 |
| TD | Touchdown passes | Credited to the passer and the receiver | 811 |
| INT | Interceptions thrown | Each also counts as a pass defended for the defender | 380 |
| SCK | Times sacked, yards lost | Not pass attempts; the yards come off net passing | 1,287 for 8,336 yards |
| CAR | Carries (rushing ATT) | Scrambles and kneel-downs included | 14,601 |
| TGT | Targets | Passes thrown to a player, caught or not | 16,609 |
| REC | Receptions | Catches | 11,217 |
| SOLO | Solo tackles | One tackler on the play | 19,678 |
| AST | Assisted tackles | Each player in a shared tackle gets one | 16,349 |
| TFL | Tackles for loss | A tackle behind the line of scrimmage | 2,589 |
| QB HIT | Quarterback hits | Hits on the passer; 1,213 of the 1,287 sacks also carried one | 3,038 |
| PD | Passes defended | Breakups and deflections, interceptions included | 2,357 |
| FF | Forced fumbles | The defender who knocked the ball loose | 366 |
| FGM-FGA | Field goals made and attempted | 85.6% made in 2025; the longest make is the kicker's LNG | 931-1,088 |
| XPM-XPA | Extra points made and attempted | 95.9% made in 2025; two-point tries are separate | 1,210-1,262 |
Rates follow from the totals: the league's PCT was 64.3%, rushers averaged 4.4 yards per carry and receivers 10.9 yards per catch. Two more you will see everywhere: LNG, the longest gain on a single play, and AVG, yards per attempt, carry or catch depending on the line it sits in.
PCT in the Standings: How a Tie Counts
| Team, 2026 through week 6 | W | L | T | PCT | PF | PA | DIFF | DIV | STRK |
|---|---|---|---|---|---|---|---|---|---|
| NYG | 3 | 2 | 1 | .583 | 136 | 140 | -4 | 1-0-1 | L1 |
| WAS | 1 | 4 | 1 | .250 | 132 | 172 | -40 | 0-2-1 | L1 |
In the standings, PCT is winning percentage, with a tie worth half a win and half a loss. The Giants are 3-2-1: PCT = (3 + 1/2) / 6 = .583. Washington is 1-4-1, (1 + 1/2) / 6 = .250. Ignoring the tie would make the Giants .600; counting it as a loss, .500. Those figures, computed from the game log, are the same .583 and .250 as the ESPN standings file the site's standings pipeline saved on October 21. PF and PA are points for and against, DIFF the difference, DIV the record inside the division (the tie was a division game), and STRK the current streak, L1 meaning one loss in a row. GB, games behind, is worked through on the games-behind page, and the order of teams with the same PCT on the tiebreakers page.
Ties are rare enough that most seasons never need the half. There were 15 tied regular-season games in 2002-2025, 0.24% of 6,223, with two at most in any season and none at all in 12 of the 24.
Abbreviations From Stat Sites and Analytics
- AV, Approximate Value: a metric from Pro Football Reference, developed by Doug Drinen, that gives each player a single score for each season, drawing on his statistics and on honors and awards. It is not part of the NFL box score and is not used on this site. Definition as described by Wikipedia, Dartmouth Sports Analytics and Packers.com, read October 22, 2026.
- PBU, pass breakup: a pass the defender knocked away. The NFL play-by-play files used here record it as a pass defended (PD).
- RAC, run after catch: another name for YAC, yards after the catch.
- QBR: ESPN's Total QBR, a different quarterback measure from passer rating (RTG); the two are compared on the passer rating vs QBR page.
- ANY/A, adjusted net yards per attempt: NY/A with touchdowns and interceptions folded in, explained on the ANY/A page.
- EPA and CPOE: expected points added and completion percentage over expected; the rest of the analytics terms are in the glossary.
What This Page Does Not Show
- Every column in every box score. Sites differ in what they print and how they label it; the page sticks to the abbreviations in the common NFL box score and the ones searched most.
- Official scoring decisions. Who gets a tackle, a QB hit or a pass defended is a judgment by the game's statisticians; the page reports how the data counts them, not whether each call was right.
- College conventions. College box scores count some plays differently; every figure here is from the NFL regular season.
Method and Sources
box score   = NYG at WAS, October 11, 2026 (week 5, 27-27), rebuilt from the play-by-play and matched
              line for line to the nflverse player game statistics
2025 totals = nflverse player game statistics, regular season; each convention re-derived from the
              play-by-play (sacks, spikes, kneel-downs, scrambles, passes defended, half sacks)
NY/A        = (passing yards - sack yards) / (attempts + sacks)
PCT         = (W + T/2) / games, checked against the ESPN standings file saved October 21, 2026
ties        = the nflverse game log, regular seasons 2002-2025 (6,223 games) and 2026 through week 6
The script make_stat_abbreviations_chart.py checks the frozen files against their recorded hashes, rebuilds every line and total above, draws the exhibit and asserts each number on this page.
Sources: nflverse play-by-play and player game statistics for 2025-2026 and the nflverse game log, pulled 10:27 am ET on October 22, 2026, before week 7 began; the ESPN standings file saved by the site's standings pipeline on October 21, 2026. The AV definition follows three independent descriptions read October 22, 2026: Wikipedia's Pro Football Reference article, a February 13, 2024 Dartmouth Sports Analytics paper and a September 3, 2026 Packers.com column.
Further reading
- Passer Rating Formula: how CMP, ATT, YDS, TD and INT become RTG
- ANY/A: yards per attempt with sacks, touchdowns and interceptions counted
- What Is YAC: the yards a receiver gains after the catch
- NFL Tiebreakers: what decides the order when PCT is level
- Field Goal Distance: what the numbers in a kicker's line measure
Your team
Kept in this browser only.
Pick the playoffs
Pick the games left and see both conferences’ seeds under the NFL’s tie-breakers.
Go deeper
Want the code behind these metrics? Work through the 43-chapter NFL analytics tutorial.
Browse tutorials Free tools