What is YAC in football?
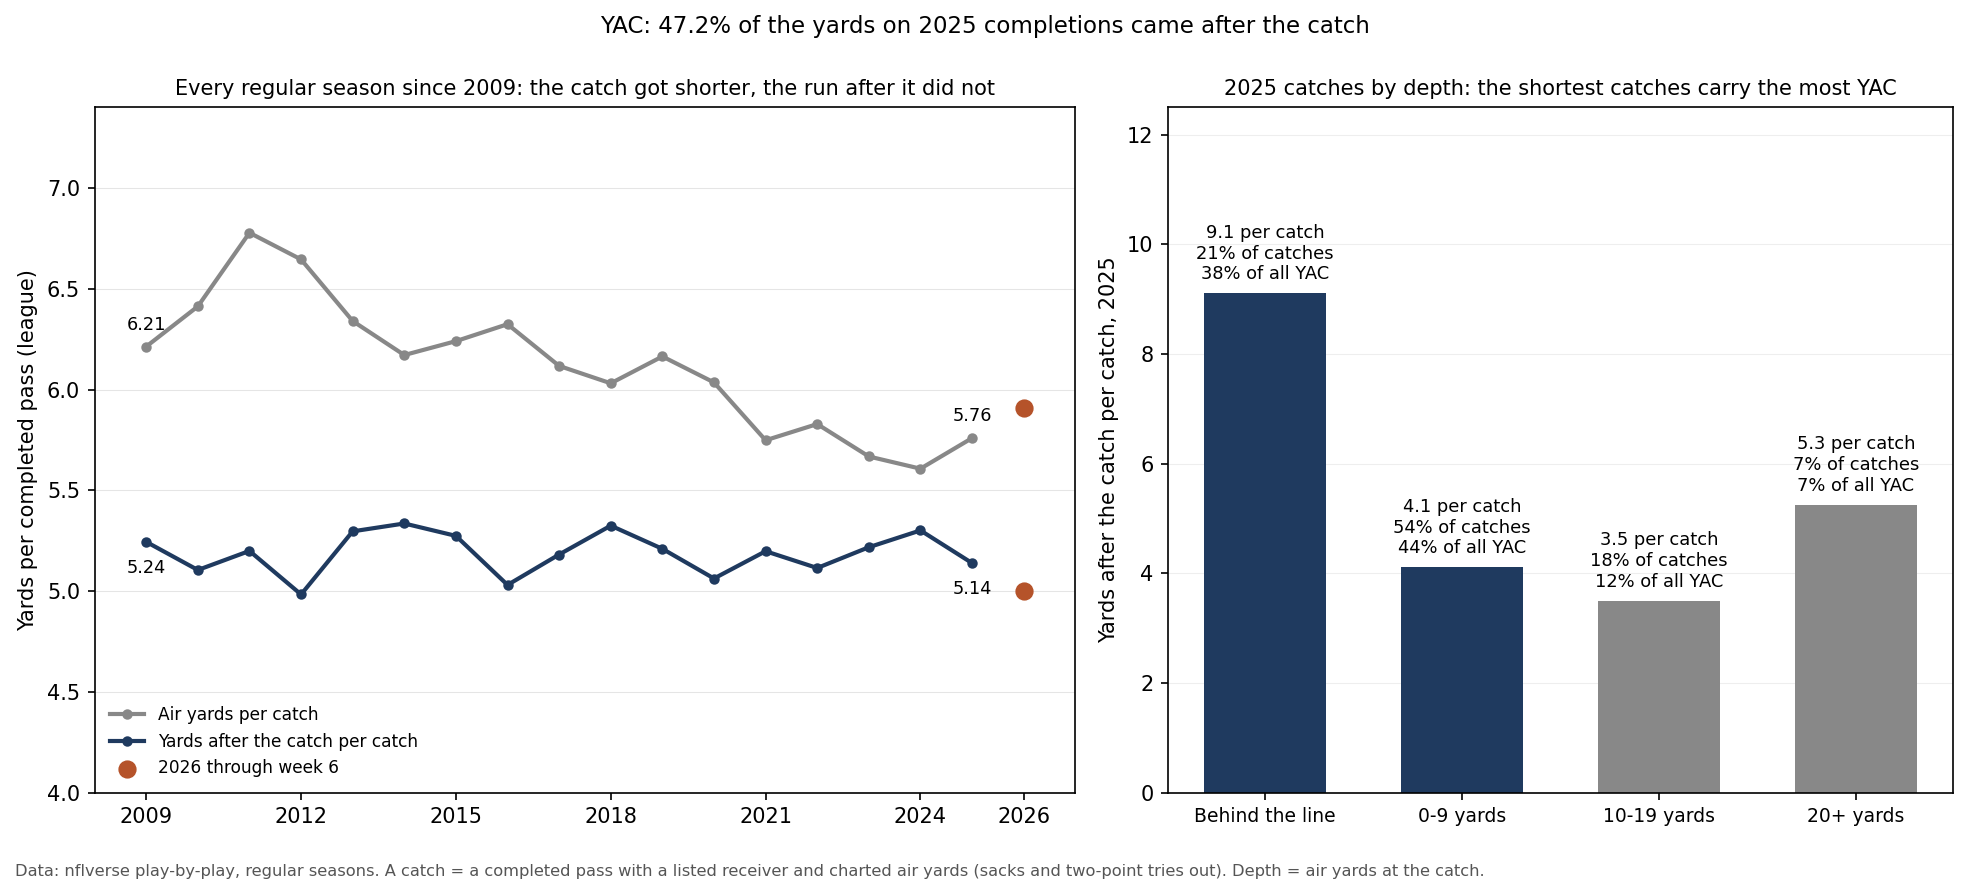
YAC stands for yards after catch: the yards a receiver gains with the ball after he catches it, measured from the spot of the catch to where the play ends. Every receiving yard is either an air yard (the distance the ball traveled past the line of scrimmage) or a yard after the catch. In the 2025 regular season 47.2% of the yards on completed passes came after the catch: 57,640 of the 122,234 air and after-catch yards on 11,216 catches. Running backs averaged 8.0 yards after the catch per reception, tight ends 4.9 and wide receivers 4.1. Some sources write RAC, run after catch, for the same yards.
Related: air yards and YAC · YAC over expected · aDOT
Figures from nflverse play-by-play: every regular-season catch since 2009, and the 93 games of 2026 through Monday, October 19, read October 22, 2026.
How YAC Is Counted
A completed pass splits into two parts. The air yards run from the line of scrimmage to the spot where the ball was caught; the yards after the catch run from there to the end of the play. Add them and you have the receiving yards on that catch:
receiving yards on a catch = air yards + yards after catch (YAC)
YAC share                  = YAC / (air yards + YAC)
On September 28, 2025, in week 4 against Washington, Michael Penix Jr. threw to Bijan Robinson 2 yards past the line of scrimmage, and Robinson ran 67 more: 2 + 67 = 69 receiving yards, 67 of them after the catch. Air yards can be negative. On November 23, 2025, in week 12 away to the Raiders, Shedeur Sanders threw to Dylan Sampson 5 yards behind the line, and Sampson ran 71 yards for a touchdown: -5 + 71 = 66. His YAC was larger than his receiving yards, which happens on every screen that gains ground.
On 99.8% of 2025-2026 catches the receiving yards equal air yards plus YAC exactly; the 26 exceptions are 23 laterals and 3 fumbles, where the ball changed hands after the catch. YAC counts as receiving yards for the receiver and as passing yards for the quarterback, never as rushing yards: in 2025 the league's passing and receiving yards were the same 122,413. YAC is also not yards after contact, which is a rushing measure, explained on the yards after contact page.
The Exhibit
Where the Catch Is Made Decides Most of It
The median 2025 catch gained 3 yards after it was made, and 25.6% gained nothing or lost ground. The total leans on a few long runs: 387 catches of 20 or more yards after the catch, 3.5% of all catches, produced 19.3% of the season's YAC. The biggest factor is depth. A receiver who catches the ball behind the line typically has blockers in front of him and defenders still some distance away.
| Depth of the catch, 2025 | Catches | Share of catches | YAC per catch | Median YAC | Share of all YAC |
|---|---|---|---|---|---|
| Behind the line | 2,378 | 21.2% | 9.1 | 8 | 37.6% |
| 0-9 yards | 6,101 | 54.4% | 4.1 | 3 | 43.6% |
| 10-19 yards | 2,004 | 17.9% | 3.5 | 1 | 12.2% |
| 20+ yards | 733 | 6.5% | 5.3 | 3 | 6.7% |
Catches made behind the line were 21.2% of catches and produced 37.6% of all YAC, at 9.1 yards each, 2.6 times the 3.5 yards after a catch 10 to 19 yards downfield. Catches 10 to 19 yards downfield gain the least after the catch, likely because they are made close to the defenders who were covering the throw. Catches 20 or more yards downfield gain a little more again, likely because a receiver who gets behind the defense has open field in front of him.
YAC by Position
| 2025 | Catches | Air yards per catch | YAC per catch | YAC as a share of receiving yards |
|---|---|---|---|---|
| Running backs | 2,330 | -0.6 | 8.0 | 108.4% |
| Tight ends | 2,867 | 5.2 | 4.9 | 48.6% |
| Wide receivers | 5,977 | 8.5 | 4.1 | 32.5% |
Running backs catch the ball behind the line on average, so as a group the backs gained 18,686 yards after the catch on 17,231 receiving yards. Wide receivers catch the ball deepest and gain the least after it: about a third of their yards come after the catch. Comparing a back's YAC with a wide receiver's says more about where each is thrown the ball than about who is harder to tackle. The other 42 catches of 2025 went to players listed at other positions: 29 to players listed as defensive backs, two-way players included, 8 to quarterbacks, 4 to offensive linemen and 1 to a defensive lineman.
The 2025 Leaders
| Most YAC, 2025 | Team | Pos | Catches | YAC | YAC per catch |
|---|---|---|---|---|---|
| Bijan Robinson | ATL | RB | 79 | 857 | 10.8 |
| Christian McCaffrey | SF | RB | 102 | 700 | 6.9 |
| Puka Nacua | LA | WR | 129 | 666 | 5.2 |
| Ja'Marr Chase | CIN | WR | 125 | 640 | 5.1 |
| Jahmyr Gibbs | DET | RB | 77 | 612 | 7.9 |
| Trey McBride | ARI | TE | 126 | 583 | 4.6 |
| Amon-Ra St. Brown | DET | WR | 117 | 570 | 4.9 |
| De'Von Achane | MIA | RB | 67 | 545 | 8.1 |
Bijan Robinson led the league with 857 yards after the catch, more than his 820 receiving yards, because his average catch came half a yard behind the line. Among the 67 players with 50 or more catches, the five highest YAC per catch belonged to four running backs and Rashee Rice, a wide receiver whose average catch came only 3.0 yards downfield.
| Highest YAC per catch (50+ catches) | YAC per catch | Air yards per catch | Lowest YAC per catch (50+ catches) | YAC per catch | Air yards per catch |
|---|---|---|---|---|---|
| Bijan Robinson, ATL | 10.8 | -0.5 | Davante Adams, LA | 1.9 | 11.2 |
| Ashton Jeanty, LV | 8.2 | -1.9 | Josh Downs, IND | 2.4 | 7.3 |
| De'Von Achane, MIA | 8.1 | -1.0 | Zach Ertz, WAS | 2.5 | 7.6 |
| Jahmyr Gibbs, DET | 7.9 | 0.0 | Tee Higgins, CIN | 2.8 | 11.5 |
| Rashee Rice, KC | 7.8 | 3.0 | Keenan Allen, LAC | 2.9 | 6.7 |
At the other end, Davante Adams caught the ball 11.2 yards downfield on average and gained 1.9 after it. Across the 67, a deeper average catch went with less YAC per catch (correlation -0.73; -0.54 among the 41 wide receivers). A low YAC figure on a receiver who wins downfield and in the end zone is a description of his job, not a flaw.
How much of YAC belongs to the player? For the 694 cases of a player with 50 or more catches in two straight seasons, 2009-2025, YAC per catch correlated 0.69 from one season to the next. Most of that is position. Within a position group the figure drops to 0.49 for wide receivers, 0.47 for tight ends and 0.29 for running backs, so a player's YAC per catch carries over only partly once his role is held fixed. Scheme, blocking and the quarterback's timing all feed into it, which is the problem YAC over expected tries to solve.
Teams: How Much of the Passing Game Comes After the Catch
| Most after the catch, 2025 | YAC share | Least after the catch, 2025 | YAC share |
|---|---|---|---|
| PIT | 65.3% | PHI | 39.0% |
| CLE | 54.6% | LA | 39.3% |
| LV | 54.5% | NE | 40.2% |
| MIA | 54.3% | JAX | 40.9% |
| KC | 53.5% | HOU | 41.3% |
Pittsburgh got 65.3% of its 2025 catch yards after the catch, more than 10 points clear of Cleveland, the next team; its quarterback, Aaron Rodgers, had the shortest average depth of target of the 30 quarterbacks with 250 or more targets, as the aDOT page shows. Philadelphia got the least, 39.0%. Neither end is better by itself: both a short passing game that relies on the run after the catch and a deeper one that gains its yards in the air can produce a good offense, and EPA is the fairer way to compare them.
The Catch Got Shorter, the Run After It Did Not
YAC per catch has stayed between 5.0 and 5.3 yards in every season since 2009, from 5.24 in 2009 to 5.14 in 2025. What changed is the air yards: the average catch was made 6.8 yards downfield in 2011 and 5.6 in 2024. As catches got shorter, the share of receiving yards gained after the catch rose with them. It was 45.8% in 2009, fell to a low of 42.9% in 2012, reached a high of 48.6% in 2024 and was 47.2% in 2025; across the seasons it tracks air yards per catch closely (correlation -0.95).
Through week 6 of 2026 YAC per catch is 5.00, the same as the first six weeks of 2025, but the share is 45.8% against 47.1%, because the average catch is being made 5.9 yards downfield against 5.6 at the same point last season. Jaylen Warren of Pittsburgh leads 2026 with 302 yards after the catch on 21 catches, 80 of them on one play: a pass from Aaron Rodgers caught at the line of scrimmage against Indianapolis on October 11 that he took 80 yards for a touchdown.
The series starts in 2009, as on the aDOT page. YAC is the gain on a catch minus its air yards, so it inherits any change in how air yards were charted, and the play-by-play's air yards per target jump by 1.8 yards between 2008 and 2009, a step no other season comes near. YAC per catch was 4.75 to 4.92 in 2006-2008 and 4.98 or more in every season since.
What This Page Does Not Show
- Who earned the yards. Raw YAC mixes the receiver's running with the blocking, the play design and where the throw put him. Tracking-based estimates of expected YAC try to separate them; see YAC over expected.
- Broken tackles. The play-by-play used here does not chart missed tackles, so it cannot say how many of the yards came from breaking one.
- Laterals. Yards gained after a lateral are left out of the per-catch figures. That is why the nflverse player totals for 2025 credit 57,818 yards after the catch, 178 more than the count here; the eight leaders above match those totals within 20 yards.
- Postseason games. Every figure is from the regular season.
Method and Sources
catch       = a regular-season completed pass with a listed receiver and charted air yards and YAC;
              sacks and two-point tries are left out (11,216 catches in 2025)
YAC         = yards gained from the spot of the catch to the end of the play
YAC share   = YAC / (air yards + YAC)
depth bands = where the ball was caught: behind the line (below 0), 0-9, 10-19 and 20+ yards past it
positions   = the nflverse players file, read October 20, 2026
qualifiers  = 50+ catches in a season (player tables and year-to-year)
2026        = the 93 games through Monday, October 19; no week 7 game is included
The script make_yac_chart.py checks the frozen files against their recorded hashes, confirms that the October 20 and October 22 reads of 2025 and 2026 agree, rebuilds every figure above from the play-by-play, draws the exhibit and asserts each number on this page.
Sources: nflverse play-by-play releases for 2006-2026 (pulled 9:09 pm ET on October 20, 2026, and again for 2025-2026, pulled 10:27 am ET on October 22, 2026), the nflverse player game statistics and players file, and the nflverse game log for scores. The 2026 figures are through Monday night of week 6.
Further reading
- Air Yards and YAC: how receiving yards split into the throw and the run after it
- What Is aDOT: how far downfield a player's targets travel
- YAC Over Expected: separating the catcher from the catch situation
- Yards After Contact: the rushing measure YAC is often confused with
- Yards per Route Run: receiving production per route
Your team
Kept in this browser only.
Pick the playoffs
Pick the games left and see both conferences’ seeds under the NFL’s tie-breakers.
Go deeper
Want the code behind these metrics? Work through the 43-chapter NFL analytics tutorial.
Browse tutorials Free tools