How do you calculate fantasy football win probability?
Take the gap between the two lineups' projected scores, divide it by about 30 PPR points, and look the result up on the normal curve: win probability = Φ(edge / 30). The 30 is how much the gap between two seven-player lineups actually varied around its projection, measured on 4,950 matchups built from real NFL weeks in 2021-2025. One correction matters: when the projections are simple season averages, the lineup projected ahead won less often than that formula says, because the real margin came out at about 0.72 times the projected one. Shrinking the edge first, Φ(0.72 × edge / 30), matched the results. A 10-point edge is worth about 59%, a 20-point edge about 68%, a 30-point edge about 76%.
Related: win probability in NFL games · target share and WOPR · snap counts and usage
Figures from nflverse weekly player statistics, PPR scoring, regular-season weeks 4-18 of 2021-2025, and weeks 4-6 of 2026, read October 22 and 23, 2026.
The Calculation
A head-to-head fantasy week is won by the lineup that scores more points. Before kickoff each lineup has a projection, and the actual score lands somewhere around it. Treat the difference between the two scores as a number that varies around the projected difference, give that variation a size, and the chance that the leader stays ahead is a normal-curve lookup:
edge                = projected points of lineup A - projected points of lineup B
win probability (A) = Φ(edge / 30)              plain version
win probability (A) = Φ(0.72 × edge / 30)       with projected edges shrunk, as measured below
Φ                   = the standard normal cumulative distribution (NORM.S.DIST(z, TRUE) in a spreadsheet)
A worked example: say lineup A is projected for 118 points and lineup B for 106, so the edge is 12 points. The plain version: a 12-point edge gives 12 / 30 = 0.40, and Φ(0.40) is 65.5%. The shrunk version: 0.72 × 12 = 8.64 points, 8.64 / 30 = 0.288, and Φ(0.288) is 61.3%. On the evidence of five seasons the second number is the one to believe when the projection is a plain average of recent games.
| Projected edge (PPR) | Φ(edge / 30) | Φ(0.72 × edge / 30) |
|---|---|---|
| 5 points | 57% | 55% |
| 10 points | 63% | 59% |
| 15 points | 69% | 64% |
| 20 points | 75% | 68% |
| 25 points | 80% | 73% |
| 30 points | 84% | 76% |
| 40 points | 91% | 83% |
The Exhibit
How the Test Was Built
The scoring is full PPR: a point for every 25 passing yards, a point for every 10 rushing or receiving yards, a point per reception, 4 points for a passing touchdown and 6 for a rushing or receiving touchdown, as in the default settings that Wikipedia's fantasy football article and NFL.com's beginner guide both describe; interceptions and lost fumbles cost 2. The nflverse weekly files carry these points for every player, and they were rebuilt here from the box-score fields to the decimal on all 97,073 player-weeks.
Each lineup is the offensive part of the default lineup: a quarterback, two running backs, two wide receivers, a tight end and a flex. Kickers and team defenses are left out because the player files do not score them. A player's projection for a week is his PPR average in his earlier games that season, which needs three games, so the test starts in week 4. Every week from 4 to 18 of 2021-2025, the players who played were ranked by that projection and dealt into twelve lineups in order: lineup 1 took the top quarterback, the 1st and 13th running backs, the 1st and 13th wide receivers, the top tight end and the best remaining flex, lineup 12 the 12th of each. Every pair of the twelve is one matchup, 66 a week. That makes 900 lineups and 4,950 matchups over 75 weeks, with projected edges from 0.6 to 57.7 points and a median of 13.1.
Where the 30 Comes From
A single lineup's weekly score varied around its projection with a standard deviation of 21.9 points; 594 of the 900 lineup-weeks (66.0%) landed within 22 points of the projection. Two lineups that vary independently by 21.9 each would differ by 21.9 × √2 = 31.0. The measured figure for the gap between two lineups was 30.0, slightly less, because some weeks were high-scoring or low-scoring across the whole league and that moved every lineup together (the average lineup's miss had a standard deviation of 7.7 points from one week to the next).
Each starter adds his own share. Quarterbacks varied by 8.5 points a week around their projection, running backs 8.3, wide receivers 8.7 and tight ends 7.4. Seven roughly independent players of that size add up to about 22, which is the lineup figure: the week-to-week noise belongs to the individual players far more than to the lineup as a whole.
| Starters, weeks 4-18 of 2021-2025 | Starts | Projected (avg.) | Scored (avg.) | Standard deviation around projection | 5 points or fewer |
|---|---|---|---|---|---|
| Quarterback | 900 | 20.0 | 18.4 | 8.5 | 6% |
| Running back | 1,800 | 15.4 | 14.6 | 8.3 | 11% |
| Wide receiver | 1,800 | 16.3 | 14.6 | 8.7 | 12% |
| Tight end | 900 | 11.8 | 11.1 | 7.4 | 24% |
Tight ends had the smallest variation in points but the most empty weeks: 24% of tight end starts produced 5 points or fewer, against 6% for quarterbacks. Under standard scoring, with no point per catch, a lineup varied by 18.7 points around its projection and the gap between two lineups by 25.6, so the divisor there is about 26 rather than 30.
Why a Projected Edge Shrinks
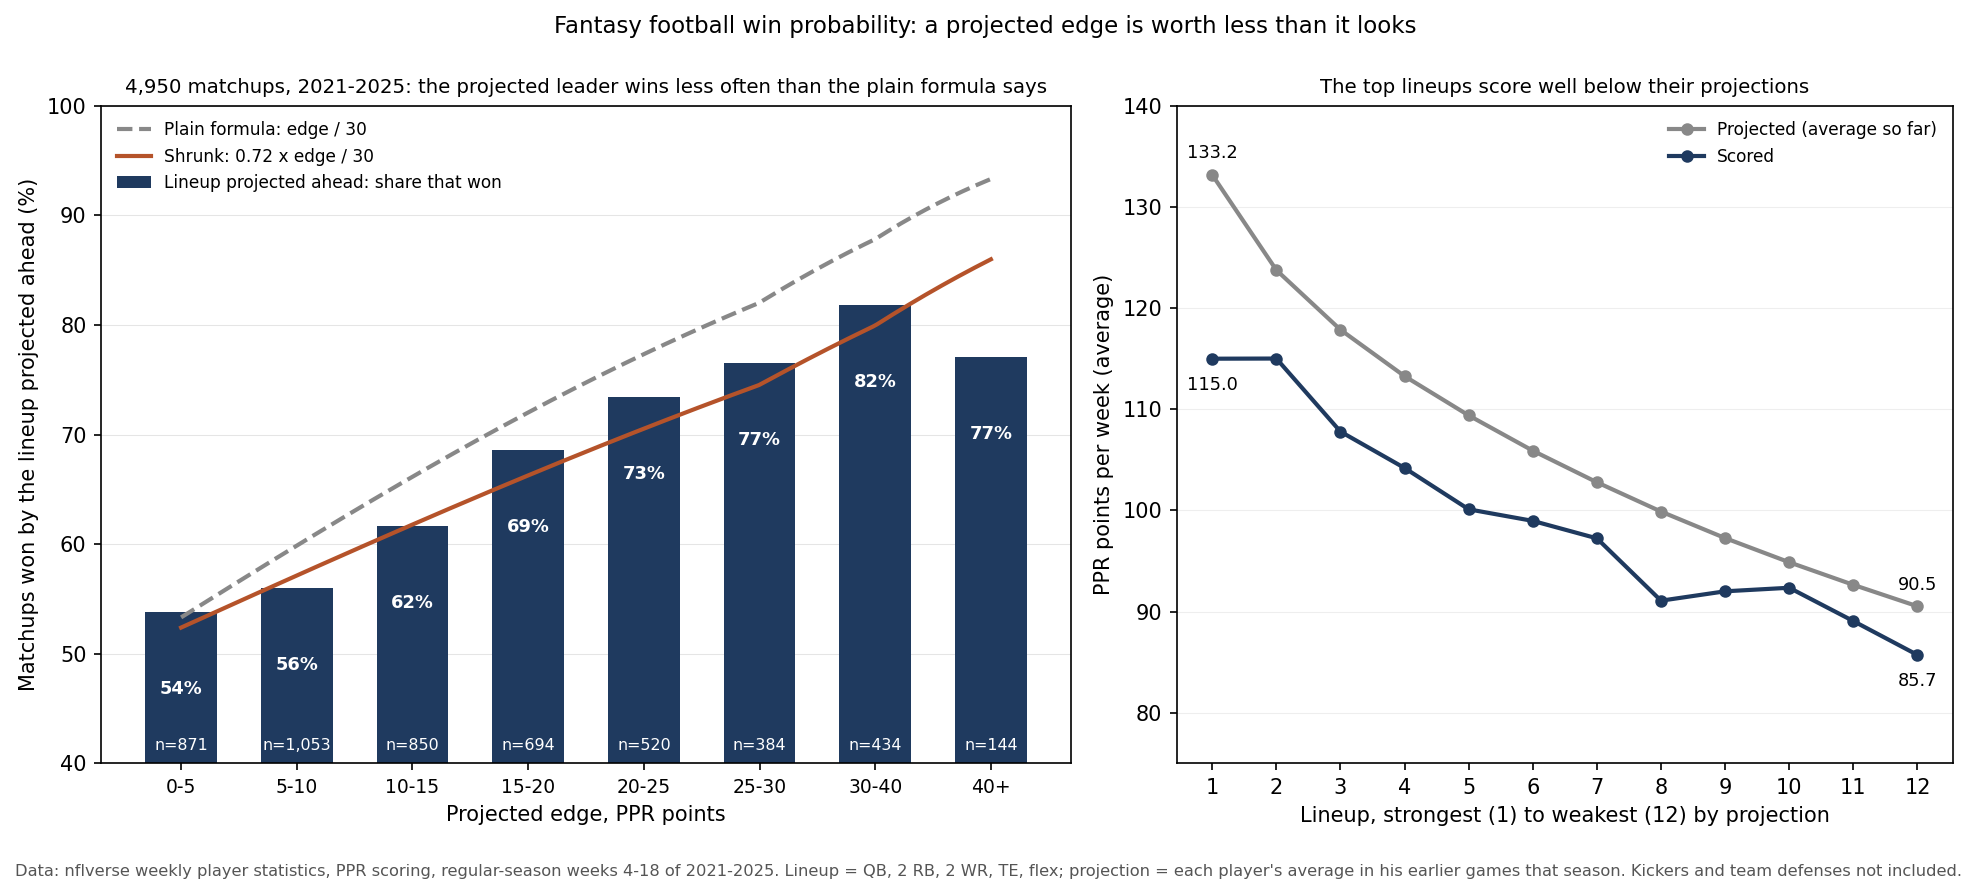
The plain formula assumes the projections are right on average. These were not. The average lineup was projected for 106.8 points and scored 99.0, and the misses were largest at the top. The strongest of the twelve lineups was projected for 133.2 points a week and scored 115.0; the weakest was projected for 90.5 and scored 85.7. A projected gap of 42.6 points between them became a real one of 29.3.
The reason is how the lineups were chosen. Ranking players by a short average picks out the ones whose recent games ran hot, and recent games are part luck, so the top of any such ranking is projected too high. Fitting the real margins against the projected ones, on average the real margin was 0.72 times the projected one, with the rest varying by 29.8 points around that. Hence the shrunk formula. The table below sets the record against both versions:
| Projected edge (PPR) | Matchups | Lineup projected ahead won | Φ(edge / 30) | Φ(0.72 × edge / 30) |
|---|---|---|---|---|
| 0-5 | 871 | 53.8% | 54.1% | 52.9% |
| 5-10 | 1,053 | 56.0% | 59.8% | 57.1% |
| 10-15 | 850 | 61.6% | 66.0% | 61.7% |
| 15-20 | 694 | 68.6% | 71.9% | 66.2% |
| 20-25 | 520 | 73.5% | 77.2% | 70.4% |
| 25-30 | 384 | 76.6% | 81.9% | 74.4% |
| 30-40 | 434 | 81.8% | 87.3% | 79.5% |
| 40+ | 144 | 77.1% | 93.0% | 85.6% |
Below 40 points the shrunk formula stays within about 3 points of what happened in every band; the plain one runs 3 to 6 points high from 5 points of edge upward. Even large leads were far from safe: 340 of 1,482 matchups with a projected lead of 20 points or more were lost, 22.9%. The 144 matchups at 40 points or more, all between the very top and very bottom lineups of a week, won 77.1%, short of both formulas; that band is where the overrated top lineups sit.
2026 So Far
The same test on weeks 4-6 of 2026 gives 36 lineups and 198 matchups. There the lineup projected ahead won 105 of 198 matchups (53.0%), where the shrunk formula expected 68.5%, and the gap between lineups varied by 29.3 points, close to the 30 of earlier seasons. Three weeks is a small sample, and early-season averages rest on three to five games, but it points the same way: a projection built only from this season's games so far promises more than it delivers.
What This Page Does Not Show
- Published projections. The projections here are plain averages of the season so far. Projections published by fantasy platforms are built differently and are not in the open data, so how well the 30 and the 0.72 carry over to them is untested.
- Kickers and team defenses. They are part of the default lineup but not of the player files. Adding two more variable scores widens the 30 somewhat.
- Inactive players. A player with no recorded statistic in a game has no row in the weekly file and was treated as not playing, the way a manager would bench him; a player hurt early in a game before recording anything is missing too.
- Real leagues. The twelve lineups are rebuilt each week from that week's ranking, so they are a test bed, not twelve real rosters, and matchups within a week share lineups.
Method and Sources
points     = nflverse fantasy_points_ppr, rebuilt from the box-score fields (exact on every row);
             standard = the same without the point per reception
lineup     = QB, RB, RB, WR, WR, TE, flex (RB/WR/TE); no kicker or team defense
projection = the player's PPR average in his earlier games that season (3+ games); weeks 4-18
league     = each week's players ranked by projection and dealt into 12 lineups in order;
             every pair of the 12 is a matchup (66 a week)
seasons    = 2021-2025 (900 lineups, 4,950 matchups); 2026 weeks 4-6 as a check
edge       = projected points of the lineup ahead minus the other's
The script make_fantasy_win_probability_chart.py checks the frozen files against their recorded hashes, rebuilds the fantasy points from the box-score fields, builds the lineups and matchups, draws the exhibit and asserts each number on this page, including the scoring and lineup definitions against saved copies of the two sources.
Sources: nflverse weekly player statistics for 2021-2024 (pulled 10:13 am ET on October 23, 2026) and 2025-2026 (pulled 10:27 am ET on October 22, 2026, weeks 1-6 of 2026). Scoring and lineup definitions: Wikipedia, Fantasy football (gridiron), and NFL.com, NFL Fantasy 101: Getting started and its fantasy terminology glossary, read October 23, 2026.
Further reading
- Win Probability and Leverage: the same idea for a real NFL game in progress
- Target Share and WOPR: the receiving opportunity numbers behind most projections
- Snap Counts and Usage: playing time before production
- What Is YAC: why running backs score more per catch
- Pythagorean Wins: another case of a record that drifts back toward its points
Your team
Kept in this browser only.
Pick the playoffs
Pick the games left and see both conferences’ seeds under the NFL’s tie-breakers.
Go deeper
Want the code behind these metrics? Work through the 43-chapter NFL analytics tutorial.
Browse tutorials Free tools