What is special teams in football?
Special teams are the units on the field for kicking plays: kickoffs, punts, field goals and extra points, plus the teams lined up to receive or stop those kicks. They are the third group of a football team, alongside the offense and the defense, and they include the specialists who rarely play anywhere else: the placekicker, the punter, the long snapper, the holder and the returners. In the 2025 NFL regular season special teams ran 7,083 plays, 26.0 a game and 17.5% of all plays, and kicks produced 32.0% of the league's points: 931 field goals and 1,210 extra points made up 4,003 of 12,519.
Related: special teams analytics · field goal distance · fourth-down decisions
Figures from nflverse play-by-play, every regular-season game since 2002 and the 93 games of 2026 through Monday, October 19, read October 23, 2026.
The Units and the Specialists
A team has three groups: the offense, the defense and special teams, the group that plays in all kicking situations. Some roles belong to special teams alone. Wikipedia's article on football positions and the NFL's own glossaries, the Football Operations terms glossary and the NFL Play Football glossary, describe them in the same terms:
| Specialist | What the job is |
|---|---|
| Placekicker (K) | Kicks off, and kicks field goals and extra points |
| Punter (P) | Comes on, usually on fourth down, to kick the ball away to the other team |
| Long snapper | Snaps the ball back to the holder on placekicks or to the punter on punts |
| Holder | Catches the snap and sets the ball for the placekicker on field goals and extra points |
| Returner | Catches kickoffs and punts and runs them back toward the other end zone |
Each kicking play has two units facing each other: a kickoff team and a kick return team, a punt team and a punt return team, a field goal or extra-point team and the side trying to block it. Kickoffs start each half and follow scores, and in 2025 they were the most common kick, 10.3 a game.
The Exhibit
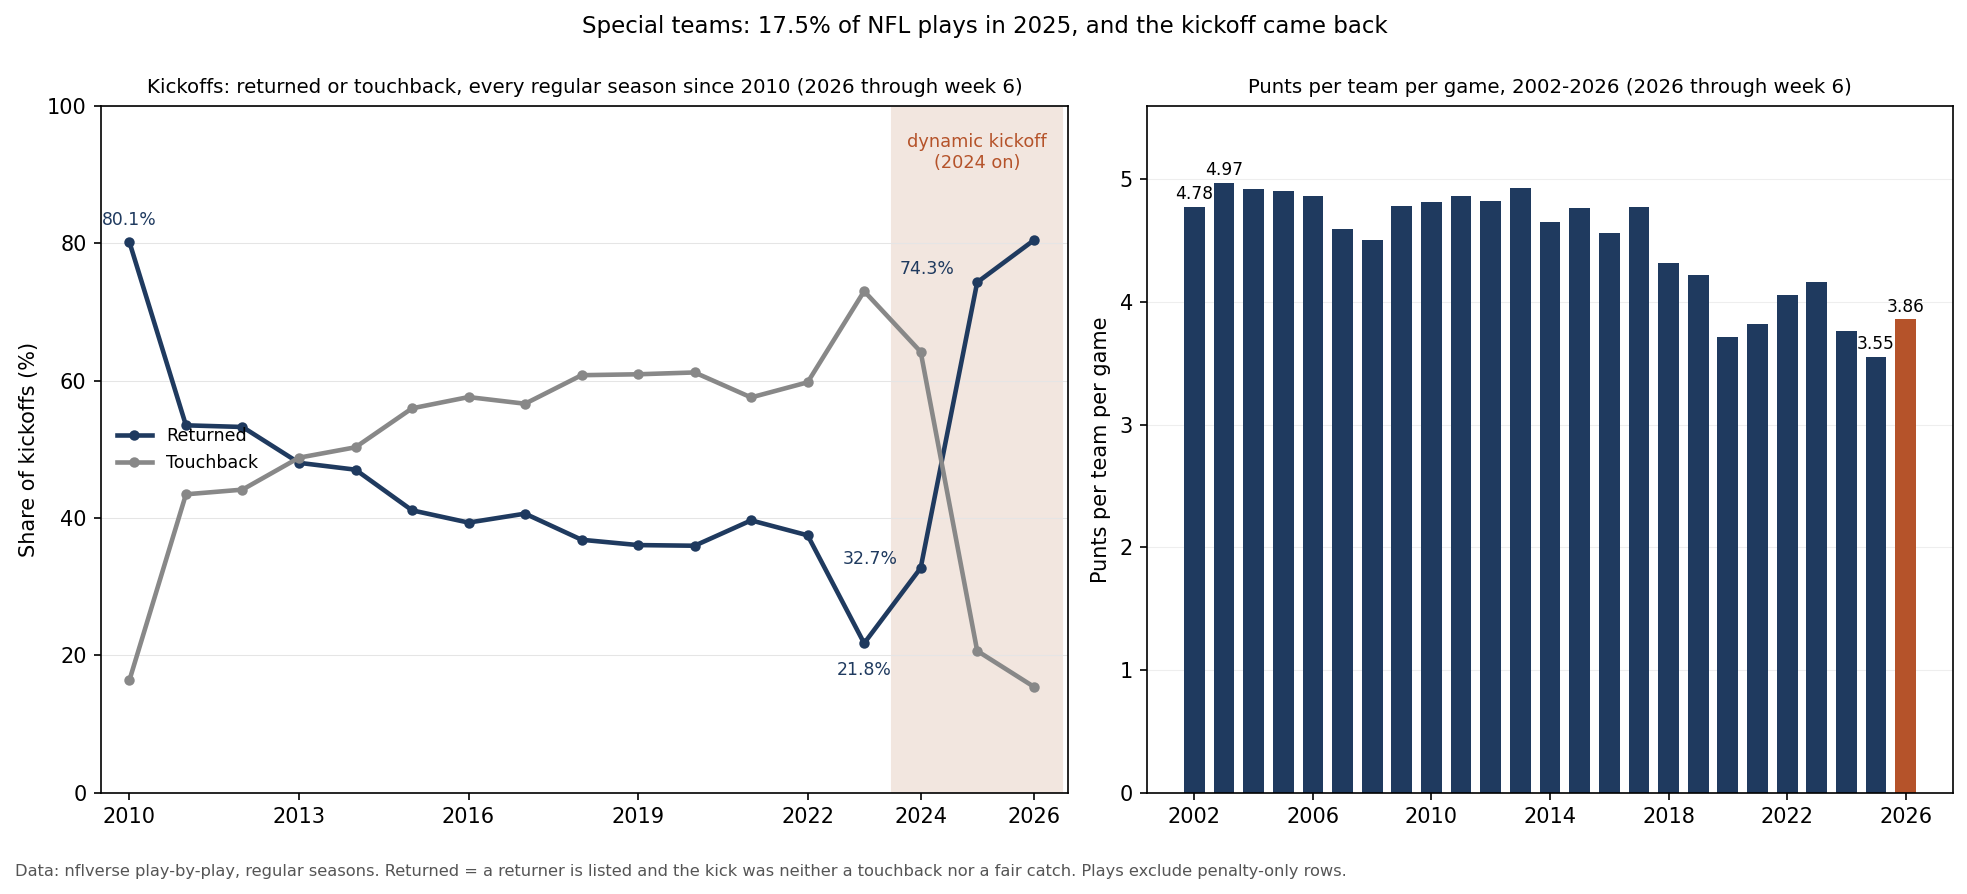
How Much of a Game Is Special Teams
Counting every play that was not wiped out by a penalty, an NFL game in 2025 had 148.7 plays, and 26.0 of them were kicks: about one play in six.
| 2025 regular season | Plays | Per game |
|---|---|---|
| Kickoffs | 2,794 | 10.3 |
| Punts | 1,933 | 7.1 |
| Field-goal tries | 1,088 | 4.0 |
| Extra-point kicks | 1,268 | 4.7 |
| All special-teams plays | 7,083 | 26.0 |
That share has barely moved. Special teams ran between 16.5% and 19% of plays in every season since 2002, and 17.7% so far in 2026 (26.9 of 152.0 plays a game). Their share of the scoring is larger. In 2025 kickers made 931 of 1,088 field-goal tries (85.6%) and 1,210 of 1,268 extra-point kicks (95.4%), 2,793 points and 1,210 points, together 4,003 of the 12,519 points scored. That 32.0% sits inside a narrow band: kicks have produced between 29.0% (2020) and 32.9% (2017) of all points in every season since 2002. Returners added 21 touchdowns in 2025, 15 on punts and 6 on kickoffs. How field-goal distance is worked out, and how often each length goes in, is on the field goal distance page.
The Kickoff Came Back
The kickoff is the special-teams play that has changed most. In 2024 the NFL adopted the dynamic kickoff. The ball is still kicked from the 35-yard line, but the other ten players on the kicking team line up at the receiving team's 40, and the returners wait in a "landing zone" between the receiving team's goal line and its 20. A touchback on a kick into the end zone put the ball at the 30 in 2024; for 2025 the league made the format permanent and moved that touchback to the 35. NFL.com's report on the 2025 vote and Wikipedia's kickoff article both give these rules.
The play-by-play shows what followed. In 2010, 80.1% of kickoffs were returned. From 2011 to 2023 the return rate never got above 55%, and in 2023 it hit its low: 21.8% returned and 73.0% touchbacks, with 92 fair catches. Under the new format 32.7% were returned in 2024, then 74.3% in 2025 once the touchback cost more, and 80.4% through six weeks of 2026. NFL.com gave the 2023 and 2024 return rates as 21.8% and 32.8%; the count here, which leaves out touchbacks and fair catches, matches the first and is a tenth of a point below the second.
| Season | Kickoffs | Returned | Touchback | Drive start after kickoff, average | Median | Kick-return TDs |
|---|---|---|---|---|---|---|
| 2023 | 2,698 | 21.8% | 73.0% | own 25.6 | own 25 | 5 |
| 2024 | 2,809 | 32.7% | 64.2% | own 30.2 | own 30 | 7 |
| 2025 | 2,794 | 74.3% | 20.7% | own 31.0 | own 31 | 6 |
| 2026 (weeks 1-6) | 965 | 80.4% | 15.4% | own 30.8 | own 30 | 0 |
Field position after kickoffs moved with the rules. The median drive after a kickoff started at the receiving team's 20 in every season from 2011 to 2015 and at its 25 from 2016 to 2023, then at the 30 in 2024 and the 31 in 2025. Of the 2,779 drives that began with a kickoff in 2025, the average started at the 31.0.
The Punt Is Fading
Each team punted 4.78 times a game in 2002 and 4.97 in 2003, the high of the series. The rate stayed above 4.2 in every season through 2019 and has been below it in every season since; 2025's 3.55 was the lowest since at least 2002, and 2026 stands at 3.86 after six weeks. Measured by drives, 39.7% of possessions ended in a punt in 2002, with a high of 41.3% in 2004, against 33.4% in 2025, again the lowest of the series. Why teams punt less is a fourth-down question, taken up on the fourth-down page; this page only counts the punts.
| How the 1,933 punts of 2025 ended | Punts | Share |
|---|---|---|
| Returned | 827 | 42.8% |
| Fair catch | 522 | 27.0% |
| Downed by the punting team | 221 | 11.4% |
| Out of bounds | 205 | 10.6% |
| Touchback | 149 | 7.7% |
| Blocked | 9 | 0.5% |
The average punt traveled 47.1 yards (nflverse's kick distance, before any return), and 757 punts, 39.2%, ended inside the receiving team's 20. Fifteen of the 827 returns went for touchdowns.
What This Page Does Not Show
- Who was on the field. The play-by-play names the kicker, punter, returner and tacklers, not the full unit, so it cannot say how many players from the offense or defense also play on kicking units.
- Penalties. Plays wiped out by a penalty are not counted, and a kick that was re-kicked counts once. Penalties on kicking plays move field position, but they are left out here.
- Value per play. This page counts plays and points. Measuring what each kick or return was worth against the alternative is the subject of the special teams analytics page and the expected points page.
- Earlier eras. The series begin in 2002 (2010 for the kickoff panel); the rules on kickoffs and touchbacks changed more than once before 2024, and this page states only the 2024 and 2025 changes, which two sources describe.
Method and Sources
special-teams play = a kickoff, punt, field-goal try or extra-point kick that was not deleted or aborted
play               = any such play, or a pass, run, kneel-down or spike; penalty-only rows are not plays
returned kickoff   = a returner is listed and it was neither a touchback nor a fair catch
points from kicks  = 3 x field goals made + extra points good, over all points in the game log
drive start        = the first snap of each drive that began with a kickoff (own yard line)
seasons            = regular seasons 2002-2025; 2026 = the 93 games through Monday, October 19
The script make_special_teams_chart.py checks the frozen files against their recorded hashes, confirms that the two frozen play files agree on every count, rebuilds every figure above from the play-by-play, draws the exhibit and asserts each number on this page, including the definitions and the kickoff rules against saved copies of the sources.
Sources: nflverse play-by-play releases for 2002-2026 (pulled 10:13 am ET on October 23, 2026; drive starts from the drives table pulled 11:08 am ET on October 21, 2026) and the nflverse game log for points. Definitions and rules, read October 23, 2026: Wikipedia, American football positions and Kickoff (gridiron football); NFL Football Operations, terms glossary; NFL Play Football, tackle football glossary; NFL.com, explaining rules for the new dynamic kickoff (2024) and owners vote to adjust ball spot on touchbacks to 35-yard line (2025).
Further reading
- Special Teams Analytics: judging kickers and kicks by what they are worth
- NFL Field Goal Distance: the yard-line table and make rates by length
- Fourth-Down Decisions: when to punt, kick or go for it
- What Is Drive 1: how drives start and end
- Two-Point Conversions: the alternative to the extra-point kick
Your team
Kept in this browser only.
Pick the playoffs
Pick the games left and see both conferences’ seeds under the NFL’s tie-breakers.
Go deeper
Want the code behind these metrics? Work through the 43-chapter NFL analytics tutorial.
Browse tutorials Free tools