How is EPA calculated?
EPA, expected points added, is the change in expected points (EP) from the start of a play to its end: EPA = EP after the play minus EP before it. EP is the average value of the next score in the half, given the down, the distance, the yard line and the clock. nflverse's public model gives every snap a probability for each of seven next scores, and EP = 7 × P(touchdown) + 3 × P(field goal) + 2 × P(safety) − 7 × P(opponent touchdown) − 3 × P(opponent field goal) − 2 × P(opponent safety). After a touchdown the "after" value is 7, after a made field goal 3, and when the ball changes hands it is minus the other team's EP. In that model a 1st-and-10 at a team's own 25 was worth 1.16 points in 2025, at midfield 2.57 and at the opponent's 25 4.18.
Related: what expected points means · success rate · fourth-down decisions
Figures from nflverse play-by-play, every regular-season snap from 2021 to 2025 and the 94 games of 2026 through Thursday, October 22, read October 24, 2026.
Step One: Expected Points Before the Snap
Expected points is the number every EPA figure is built on. The expected points page explains the idea; this page shows the arithmetic and the real values. The method comes from the nflscrapR work of Ronald Yurko, Samuel Ventura and Maksim Horowitz (2018), whose paper sorts the next score in the same half into seven outcomes: a touchdown (7 points), a field goal (3), a safety (2), no score (0), and the opponent's safety, field goal or touchdown (−2, −3, −7). nflverse's play-by-play, built by its nflfastR package, publishes the chance of each of those seven outcomes on every play and an EP value computed from them.
Expected points is the probability-weighted sum of those point values:
EP  = 7 x P(TD) + 3 x P(FG) + 2 x P(safety)
    - 7 x P(opp TD) - 3 x P(opp FG) - 2 x P(opp safety)     (no score counts 0)
EPA = EP after the play - EP before the play
On every one of the 198,779 snaps of 2021 to 2026 in the play-by-play, that sum reproduces nflverse's EP to the last decimal, and the seven probabilities add to 1 on each snap. The probabilities themselves come from a fitted model. According to Ben Baldwin's description of the nflfastR models, they are trained with xgboost on the seconds left in the half, the yard line, the down, the yards to go, whether the team with the ball is at home, the roof type, the timeouts each team has left, and an era marker for different stretches of NFL history. The original nflscrapR version used multinomial logistic regression on the same core inputs.
The Exhibit
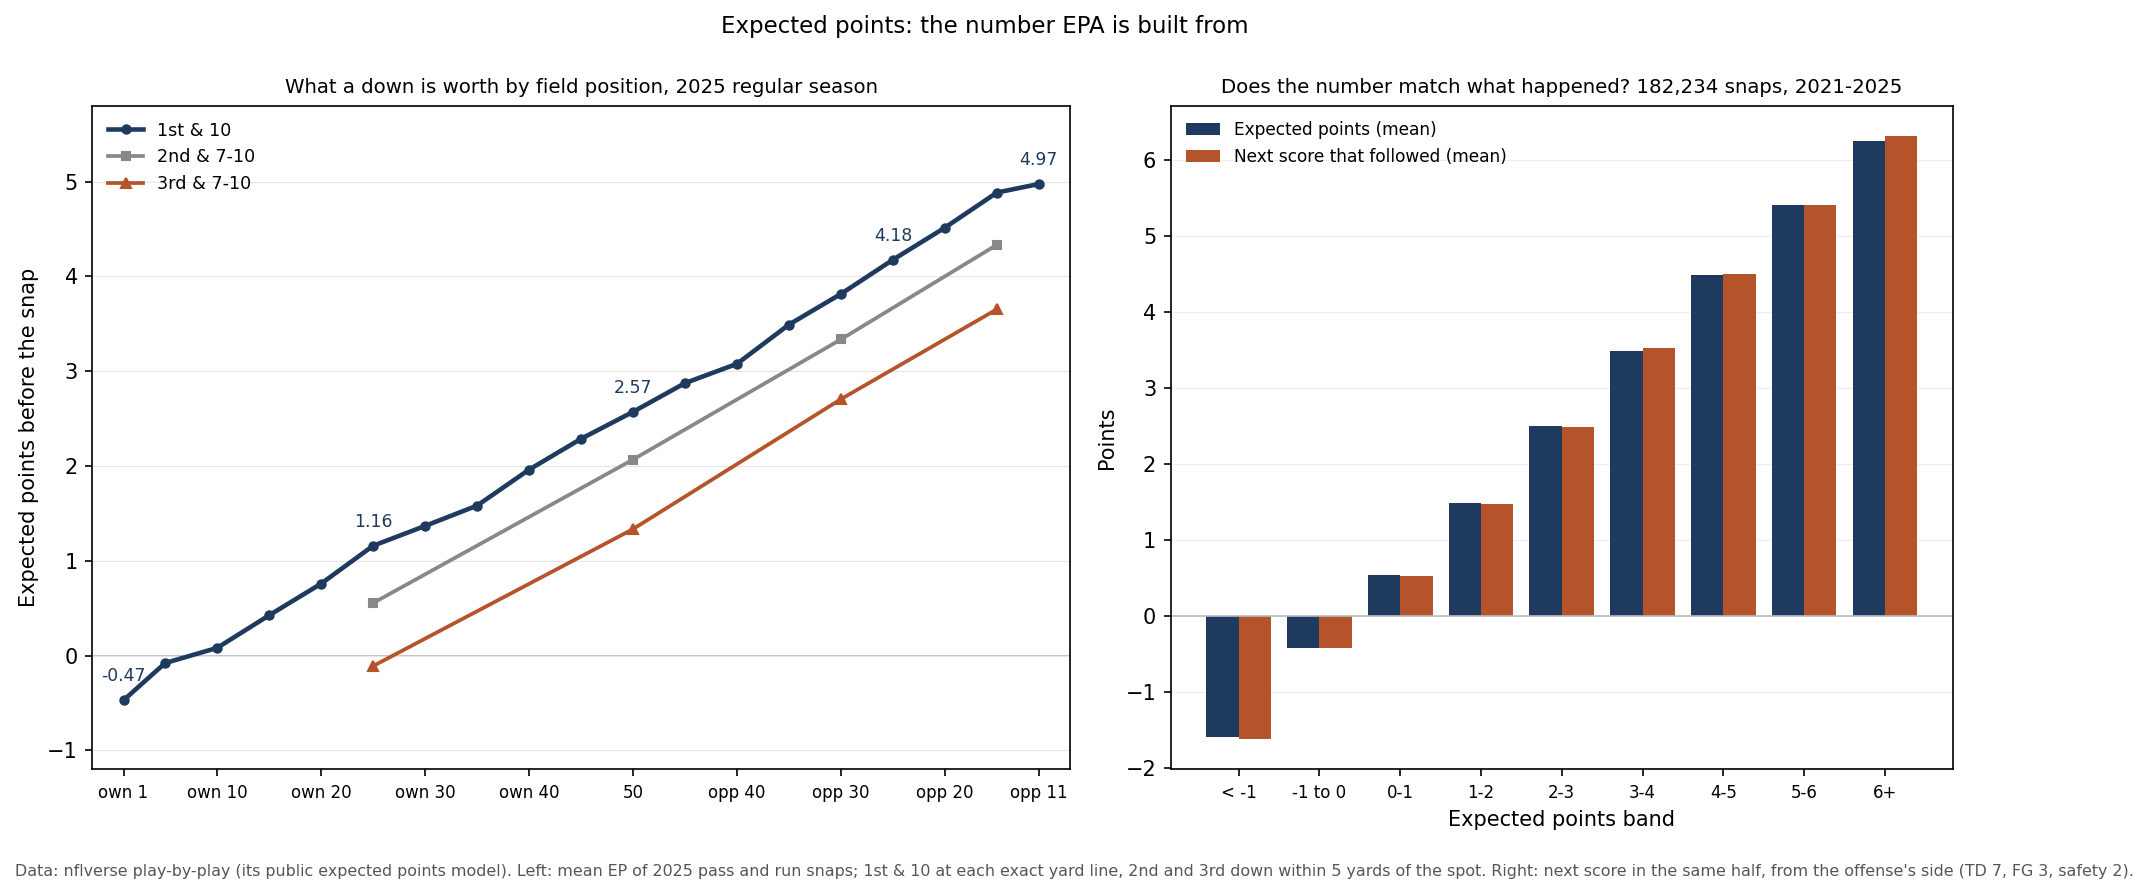
The Expected Points Table: 1st and 10
This is the lookup an EPA calculator needs. Each row is the average EP of every 1st-and-10 pass or run snap in the 2025 regular season from exactly that yard line, in any quarter.
| 1st and 10 from | Expected points | 2025 snaps |
|---|---|---|
| Own 1 | −0.47 | 31 |
| Own 5 | −0.08 | 37 |
| Own 10 | +0.08 | 79 |
| Own 15 | +0.43 | 96 |
| Own 20 | +0.76 | 364 |
| Own 25 | +1.16 | 199 |
| Own 30 | +1.37 | 262 |
| Own 35 | +1.58 | 634 |
| Own 40 | +1.96 | 256 |
| Own 45 | +2.29 | 192 |
| Midfield | +2.57 | 157 |
| Opponent's 45 | +2.87 | 176 |
| Opponent's 40 | +3.08 | 159 |
| Opponent's 35 | +3.49 | 156 |
| Opponent's 30 | +3.82 | 134 |
| Opponent's 25 | +4.18 | 124 |
| Opponent's 20 | +4.51 | 123 |
| Opponent's 15 | +4.88 | 106 |
| Opponent's 11 | +4.97 | 141 |
A 1st-and-10 on a team's own 1 was worth −0.47 points, its own 20 0.76 and the opponent's 11 4.97. The value rises at every step, and across the field every 10 yards gained is worth about 0.62 points. Inside the 10 the down becomes 1st-and-goal: 1st-and-goal at the 1 averaged 6.35. Below zero means the next score in the half was more likely to belong to the other team, through a safety or a short field after a punt.
The clock matters as well as the spot. In the first and third quarters a 1st-and-10 between the own 23 and 27 averaged 1.17 (489 snaps); in the last two minutes of a half the same spot averaged 0.61 (73), because there is less time to drive the length of the field before the half ends and nobody scores.
Down and Distance
Later downs are worth less from the same spot, and longer distances less again. Each cell is the average EP of 2025 pass and run snaps within 5 yards of the spot named.
| Down and distance | Own 20-30 | Own 45 to opp. 45 | Opp. 25-35 | Opp. 10-20 |
|---|---|---|---|---|
| 1st & 10 | +1.08 | +2.58 | +3.82 | +4.81 |
| 2nd & 1-3 | +1.17 | +2.68 | +3.88 | +4.97 |
| 2nd & 4-6 | +0.80 | +2.35 | +3.57 | +4.60 |
| 2nd & 7-10 | +0.55 | +2.07 | +3.34 | +4.33 |
| 2nd & 11+ | +0.28 | +1.83 | +3.07 | +3.88 |
| 3rd & 1-3 | +0.56 | +2.03 | +3.26 | +4.37 |
| 3rd & 4-6 | +0.10 | +1.54 | +2.94 | +3.91 |
| 3rd & 7-10 | −0.11 | +1.34 | +2.71 | +3.65 |
| 3rd & 11+ | −0.48 | +0.98 | +2.42 | +3.21 |
2nd and 7-10 at midfield is worth 2.07 points, 3rd and 7-10 from the same area 1.34: a failed first-down play costs about three-quarters of a point before anything else happens. 3rd and 11 or more near a team's own 25 is worth less than nothing, −0.48, since the likeliest next event is a punt that hands the other team the ball. 2nd and short is worth slightly more than 1st and 10 from the same spot, because one short gain brings a fresh set of downs. Fourth down is left out of the table: most fourth downs are punts and field-goal tries, and the choice between them is the subject of the fourth-down page.
Step Two: The Value After the Play
EPA needs a second EP value, the one after the play. nflverse sets it by three rules, and the play-by-play shows each one holding:
- The offense keeps the ball: the after-value is the EP of its next snap. That held on 99.9% of the 146,923 snaps where the same team snapped again; the rest are plays logged out of order.
- The ball changes hands (a punt, an interception, a lost fumble, a failed fourth down): the after-value is minus the other team's EP on its first snap. That held on 99.7% of the 14,961 where the other team had the ball next.
- A score: a touchdown counts 7 and a made field goal 3. All 6,926 offensive touchdowns from 2021 to 2026 show an after-value of exactly 7 and all 4,894 made field goals exactly 3.
A play's EPA is then the after-value minus the before-value. nflfastR's success indicator is simply whether that number is above zero, which is how success rate is defined.
A Worked Drive
Baltimore opened the third quarter at Buffalo on September 7, 2025, week 1, with a four-play touchdown drive. Each row is the EP before the snap and the EPA of the play:
| Snap | EP before | EPA |
|---|---|---|
| 1st & 10, own 35 | 1.27 | −0.13 |
| 2nd & 7, own 38 | 1.14 | −0.83 |
| 3rd & 7, own 38 | 0.31 | +4.15 |
| 1st & 10, BUF 23 | 4.46 | +2.54 |
Derrick Henry ran for 3 yards, which still lost value, 1.27 down to 1.14, because 2nd and 7 is worth less than 1st and 10 three yards back. Lamar Jackson was sacked for no gain: 2nd and 7 became 3rd and 7 from the same spot, 1.14 down to 0.31, −0.83. On 3rd and 7 Jackson hit Zay Flowers for 39 yards to the Buffalo 23, a 1st-and-10 worth 4.46: 4.46 − 0.31 = +4.15. Flowers then caught a 23-yard touchdown, worth 7: 7 − 4.46 = +2.54. The plays add up exactly: −0.13 + −0.83 + 4.15 + 2.54 = 5.73, which is 7 minus the 1.27 the drive started with. That is true of every drive, since each EPA hands its end value to the next play.
What Each Kind of Play Was Worth in 2025
Across the 32,813 pass and run snaps of 2025 the average EPA was +0.007, close to zero by construction. Sorted by what happened, in the order listed (a sack that lost a fumble counts as a lost fumble):
| Result of the snap | Snaps | Average EPA |
|---|---|---|
| Touchdown | 1,323 | +2.45 |
| Interception | 379 | −4.50 |
| Lost fumble | 216 | −4.97 |
| Sack | 1,212 | −1.51 |
| Penalty on the play | 458 | +0.45 |
| Incomplete pass | 5,703 | −0.85 |
| Gain for a first down | 8,088 | +1.29 |
| Any other gain, no gain or loss | 15,434 | −0.27 |
A touchdown is worth less than you might guess, +2.45 on average, because most touchdowns are scored from close range, where the before-value was already high. A turnover costs the most: an interception or a lost fumble wipes out the offense's EP and hands the other team a good one. A gain that falls short of a first down averaged −0.27, because it uses up a down. What a turnover is and how often it happens is on the turnovers page.
Does the Number Match What Happened?
From 2021 to 2025, across 182,234 snaps, the average EP before the snap was 2.04 and the average next score that followed was 2.03 (touchdown 7, field goal 3, safety 2, minus for the other team, 0 when nobody scored before the half ended). Grouped into nine bands of EP, from below −1 to above 6, in every band the two were within 0.06 of a point. That is a description of these seasons, not an independent test: nflverse fits its model on seasons that include them. Baldwin's write-up reports the out-of-sample check, which leaves one season out at a time.
What This Page Does Not Show
- Other models. Every figure here is nflverse's public model. Other publishers fit their own expected points, with other inputs, so their EPA for the same play can differ.
- Team quality. EP is the league-average value of a situation; a strong offense beats it and a weak one falls short.
- Exact situations. The tables average real snaps, so the clock, the timeouts and the roof vary inside each row. A single snap's EP can sit well away from its row's average, as the end-of-half figure shows.
- Win probability. EPA counts points, not wins; a field goal late in a tied game is worth more to the result than its 3 points suggest. That is the subject of the win probability page.
Method and Sources
snap            = a pass or run play with a down; no two-point tries, kneel-downs, spikes or penalty-only rows
1st & 10 table  = mean nflverse EP of every 2025 1st-and-10 snap at exactly that yard line, all quarters
down table      = mean EP of 2025 snaps within 5 yards of the spot named
EPA rules       = checked against the next snap in the same half, 2021-2026
next score      = next touchdown (7), field goal (3) or safety (2) in the same half, minus if the other
                  team scored, 0 if none; snaps 2021-2025 (passes, runs, punts, field-goal tries)
seasons         = regular seasons 2021-2025; 2026 = the 94 games through Thursday, October 22 (formula check only)
The script make_epa_calculation_chart.py checks the frozen file against its recorded hash, recomputes EP from the seven probabilities on every snap, checks the after-value rules, rebuilds both tables, the worked drive and the comparison with what happened, draws the exhibit and asserts each number on this page, including the definitions against saved copies of the sources.
Sources: nflverse play-by-play releases for 2021-2026, pulled 9:46 am ET on October 24, 2026. Definitions, read October 24, 2026: Yurko, Ventura and Horowitz, nflWAR: A Reproducible Method for Offensive Player Evaluation in Football (arXiv, 2018); nflfastR, field descriptions; Ben Baldwin, nflfastR EP, WP, CP, xYAC and xPass models (Open Source Football).
Further reading
- Expected Points and EPA: what the numbers mean and how they drive decisions
- Success Rate: the share of plays with positive EPA
- Fourth-Down Decisions: go, punt or kick, priced in expected points
- What Is a Turnover: interceptions, lost fumbles and what they cost
- Win Probability: the same idea measured in wins
Your team
Kept in this browser only.
Pick the playoffs
Pick the games left and see both conferences’ seeds under the NFL’s tie-breakers.
Go deeper
Want the code behind these metrics? Work through the 43-chapter NFL analytics tutorial.
Browse tutorials Free tools