What is a turnover in football?
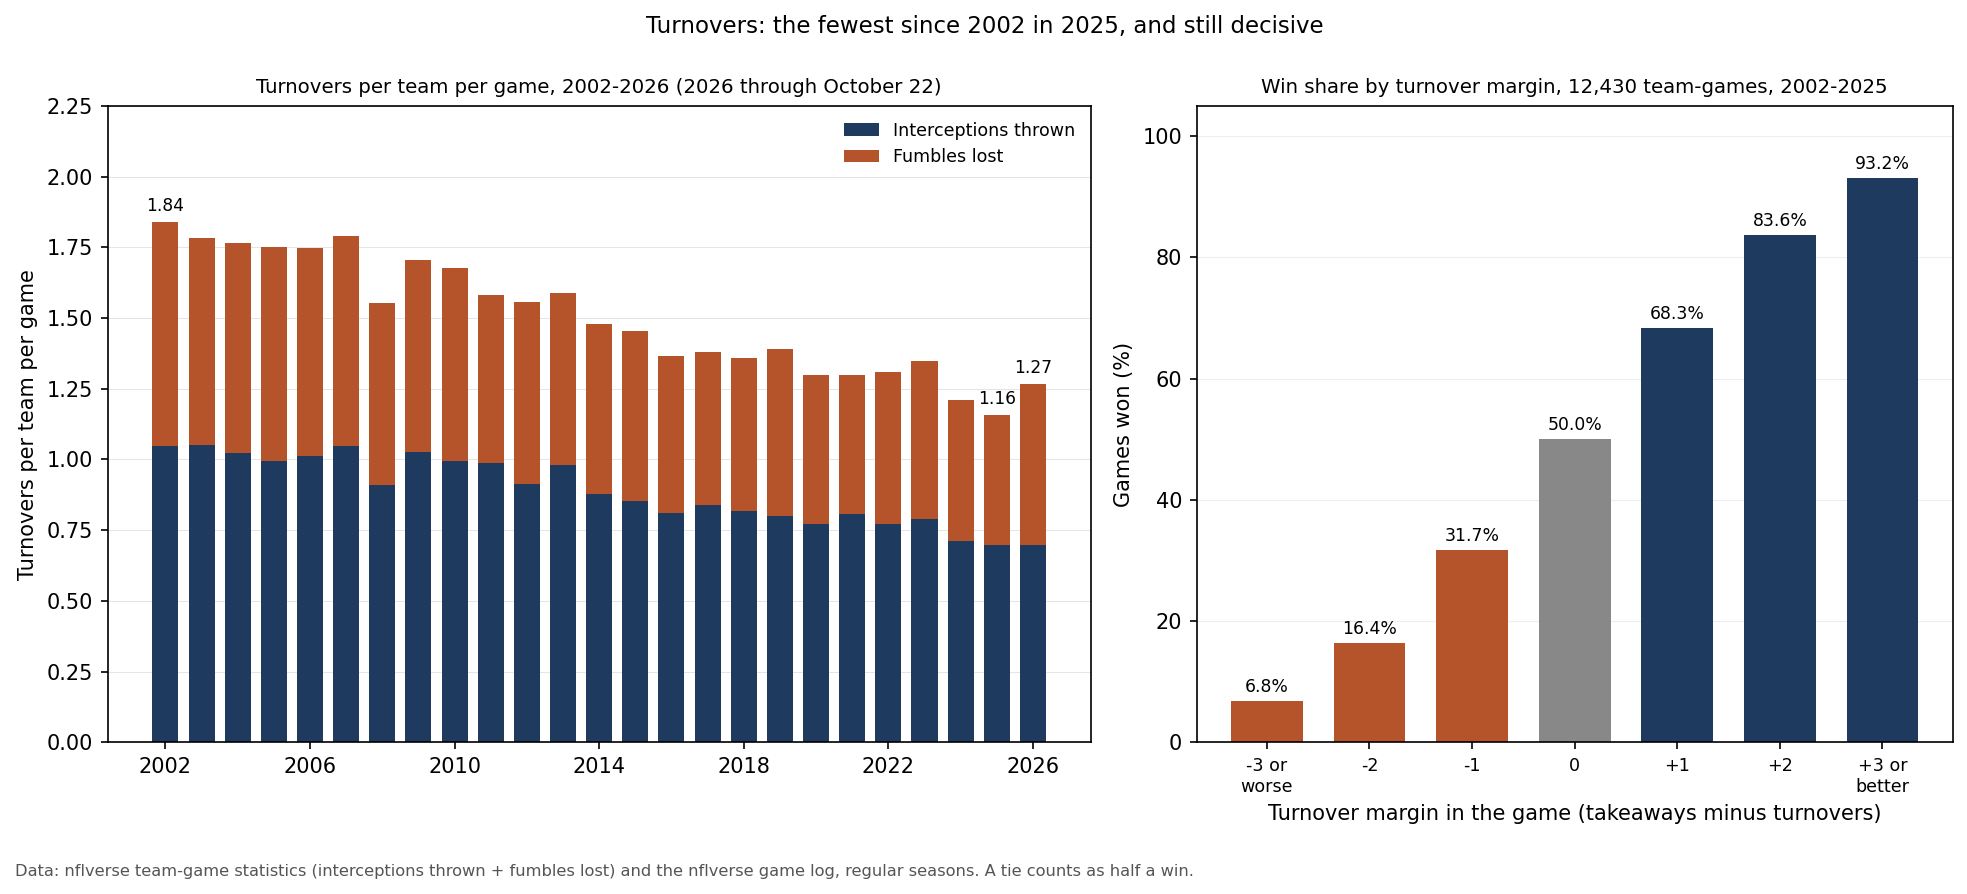
A turnover is when the team with the ball loses it to the other team by an interception or a lost fumble. An interception is a forward pass caught by a defender; a fumble becomes a turnover only when the other team recovers it. A failed fourth down, a turnover on downs, also hands the ball over, but it is a separate entry and is left out of the turnover count. For the defense the same play is a takeaway. In the 2025 NFL regular season teams turned the ball over 629 times, 380 interceptions and 249 lost fumbles, 1.16 per team per game and the fewest since at least 2002. Turnovers still decide games: from 2002 to 2025, in games where one side had fewer turnovers, the team with fewer turnovers won 78.8% of the time.
Related: turnovers and luck · how EPA is calculated · 2026 turnover differential
Figures from nflverse team statistics and play-by-play, every regular-season game since 2002 and the 94 games of 2026 through Thursday, October 22, read October 24, 2026.
What Counts as a Turnover
Wikipedia and the NFL's own glossaries, the Football Operations terms glossary and the NFL Play Football glossary, describe the terms the same way:
| Term | What it means |
|---|---|
| Turnover | The defense gains possession of the ball from the offense, usually by intercepting a pass or recovering a fumble |
| Interception | A defender catches a forward pass thrown by the offense, and possession changes |
| Fumble | A player with the ball drops it during a play; it is a live ball and either team may recover it |
| Turnover on downs | The offense uses its four downs without a first down or a score, and the other team takes over where the last play ended |
| Takeaway | The defense's side of a turnover: getting the ball away from the team on offense |
| Pick-six | An interception returned for a touchdown, six points |
A fumble the offense falls back on is not a turnover; only a lost fumble counts. Wikipedia notes that NFL game statistics count only lost fumbles and interceptions as turnovers, and the NFL's glossary lists the turnover on downs as its own term. Turnover margin, as this page counts it, is the takeaways a team makes minus the turnovers it commits. Punts change possession too, but by choice, and they are not turnovers. The takeaway definition is from two dictionaries, Dictionary.com and the Cambridge Dictionary.
The Exhibit
How Often Turnovers Happen
| Season | Interceptions | Lost fumbles | Per team per game |
|---|---|---|---|
| 2002 | 528 | 399 | 1.84 |
| 2007 | 537 | 380 | 1.79 |
| 2012 | 468 | 329 | 1.56 |
| 2017 | 430 | 276 | 1.38 |
| 2022 | 418 | 292 | 1.31 |
| 2025 | 380 | 249 | 1.16 |
| 2026 (through Oct. 22) | 131 | 107 | 1.27 |
Turnovers have been falling for two decades. Teams turned it over 1.84 times a game in 2002 and above 1.7 times in every season through 2007; every season since 2014 has been below 1.6, and 2025's 1.16 was the lowest. Interceptions fell from 1.05 per team per game in 2002 to 0.70 in 2025, lost fumbles from 0.79 to 0.46. The 2003-2025 average was 1.50. Through October 22, 2026 the rate is 1.27 (238 in 94 games): interceptions are level at 0.70, lost fumbles are up at 0.57. In 2025 a game had 2.31 turnovers between the two teams.
The 2025 lost fumbles came from every phase. Of the 248 in the play-by-play, 216 were lost by the offense on runs and passes, including sacks and catches, 28 on kickoffs, punts and a field-goal try, and 4 by a defense that had just taken the ball away and then fumbled it back. nflverse's team statistics count 249, one more than its play-by-play: a December game between the Eagles and the Chargers had an interception and two fumbles on a single play, and the play-by-play records one of the fumbles.
There were 358 turnovers on downs in 2025, close to the 380 interceptions, but none of them appear in a team's turnover total.
What a Turnover Costs
Measured in expected points (how EPA works is on the EPA calculation page), the average interception cost the offense 4.50 expected points and the average lost fumble 4.97, on 2025 runs and passes. For scale, a sack cost 1.51. A turnover erases whatever the offense's position was worth and gives the other team the ball, often on a short field. A turnover on downs cost 2.87 on average (358 failed fourth-down plays), less than an interception or a lost fumble.
Some turnovers score directly: in 2025, 28 of the 380 interceptions (7.4%) were returned for touchdowns, pick-sixes, and 18 lost fumbles were. Most hand the other offense a short field:
| 2025 drives | Drives | Median start | Scored | Touchdown |
|---|---|---|---|---|
| After an interception | 342 | own 46 | 55.3% | 31.9% |
| After a lost fumble | 201 | own 49 | 57.2% | 32.3% |
| After a turnover on downs | 350 | own 38 | 34.0% | 16.6% |
| After a kickoff | 2,779 | own 31 | 39.8% | 23.9% |
| After a punt | 1,893 | own 20 | 34.8% | 21.0% |
Drives that started after an interception scored 55.3% of the time and after a lost fumble 57.2%, against 39.3% for all 5,744 drives. A drive after a turnover on downs scored less often than one after a kickoff (34.0% against 39.8%) even though it started seven yards further up the field.
Turnover Margin and Winning
Turnover margin in a game is the opponent's turnovers minus a team's own. Across 12,430 team-games from 2002 to 2025:
| Turnover margin in the game | Team-games | Won |
|---|---|---|
| −3 or worse | 1,176 | 6.8% |
| −2 | 1,458 | 16.4% |
| −1 | 2,274 | 31.7% |
| 0 | 2,614 | 50.0% |
| +1 | 2,274 | 68.3% |
| +2 | 1,458 | 83.6% |
| +3 or better | 1,176 | 93.2% |
A team that won the turnover margin by one won 68.3% of its games, by two 83.6%, by three or more 93.2%. Teams finished even in 21.0% of games. The table shows outcomes, not causes, and margin in one game says little about the next; why turnover margin swings so much from season to season is the subject of the turnovers and luck page, and the 2026 team margins are on the turnover differential page.
What This Page Does Not Show
- Forced fumbles and fumble recoveries. Who forced a fumble and how often fumbles are recovered are left out here; the recovery side is on the turnovers and luck page.
- Turnovers wiped out by penalties. A play cancelled by a penalty does not count; the counts are as nflverse records them.
- Before 2002. The series begin in 2002, so "fewest" means since 2002.
- Cause and effect. The margin table describes outcomes; it does not separate turnovers that caused a loss from turnovers that came because a team was already losing.
Method and Sources
turnovers        = interceptions thrown + fumbles lost (nflverse team-game statistics)
per team per game = turnovers / team-games, regular seasons 2002-2025; 2026 = the 94 games through Oct. 22
turnover margin  = the opponent's turnovers - the team's own, per game; a tie counts as half a win
turnover on downs = a 4th-down run or pass that ended the series without a first down (play-by-play)
cost             = average EPA of 2025 run and pass snaps ending in an interception, a lost fumble or a
                   turnover on downs
drives           = nflverse drives grouped by how they started; scored = a touchdown or field goal
The script make_turnover_chart.py checks the frozen files against their recorded hashes, confirms that the 10/15 and 10/24 team statistics agree on every 2025 game, rebuilds every figure above, draws the exhibit and asserts each number on this page, including the definitions against saved copies of the sources.
Sources: nflverse team-game statistics (2002-2024 pulled October 15, 2026; 2025-2026 pulled 9:46 am ET on October 24, 2026), play-by-play releases for 2002-2026 (pulled 9:46 am ET on October 24, 2026) and the nflverse game log for results. Definitions, read October 24, 2026: Wikipedia, Turnover (gridiron football), Interception, Fumble and Glossary of American football; NFL Football Operations, terms glossary; NFL Play Football, tackle football glossary; Dictionary.com and the Cambridge Dictionary (takeaway).
Further reading
- Turnovers and Luck: why turnover margin does not repeat
- How EPA Is Calculated: the expected points table behind the turnover cost
- Turnover Differential 2026: every team's margin this season
- What Is Drive 1: how drives start and end
- Fourth-Down Decisions: the price of a turnover on downs
Your team
Kept in this browser only.
Pick the playoffs
Pick the games left and see both conferences’ seeds under the NFL’s tie-breakers.
Go deeper
Want the code behind these metrics? Work through the 43-chapter NFL analytics tutorial.
Browse tutorials Free tools