What does 3rd and 12 mean in football?
3rd and 12 means third down with 12 yards to go to the line to gain. An offense gets four downs to move the ball 10 yards; the first number is the down it is on and the second is how far it still has to go. Reach the line and it starts again at 1st and 10; fall short after fourth down and the ball goes to the other team. From 1st and 10, NFL offenses kept the series going 71.7% of the time, pooled over the 2016 to 2025 regular seasons; from 3rd and 1, 78.1%; from 3rd and 12, 26.6%.
Related: third-down conversion rate · fourth-down decisions · success rate
Figures from nflverse play-by-play, every regular-season game from 2016 to 2025 and the 106 games of 2026 through Sunday, October 25, read October 26, 2026.
How Downs Work
The rules below are from the 2026 NFL Rulebook (Rule 3, Section 8 and Rule 7, Section 3), and the NFL Football Operations glossary and Wikipedia describe them the same way.
- A series of downs. The offense gets four downs, or plays from scrimmage, to move the ball to the line to gain. The first play of a series is first down and the next ones are second, third and fourth down.
- The line to gain. It is 10 yards beyond the spot of the snap that starts the series. On the field, the chain crew uses a 10-yard chain to track it, and the down judge tells the referee which down it is.
- A new first down. When the ball is declared dead at or beyond the line to gain, the offense gets a new series, starting again at 1st and 10.
- Turnover on downs. If the offense is still short after fourth down, the other team gets the ball where the play ended. That is why most teams punt or try a field goal on fourth down instead of running a play.
- And goal. If the goal line is less than 10 yards away, the goal line is the line to gain, and the situation is called 1st and goal. The offense cannot earn another first down there without a penalty; it has to score.
- Penalties move the line. A penalty on the offense pushes the ball back while the line to gain stays put, which is how 1st and 15 or 1st and 20 happens. A penalty on the defense that moves the ball past the line, or one that carries an automatic first down, gives the offense a new series.
So the name of a situation is always the down and the distance. A team that gains 4 yards on 1st and 10 faces 2nd and 6. If it then loses 2 yards, it faces 3rd and 8. The rulebook writes the reset as first-and-10.
The Exhibit
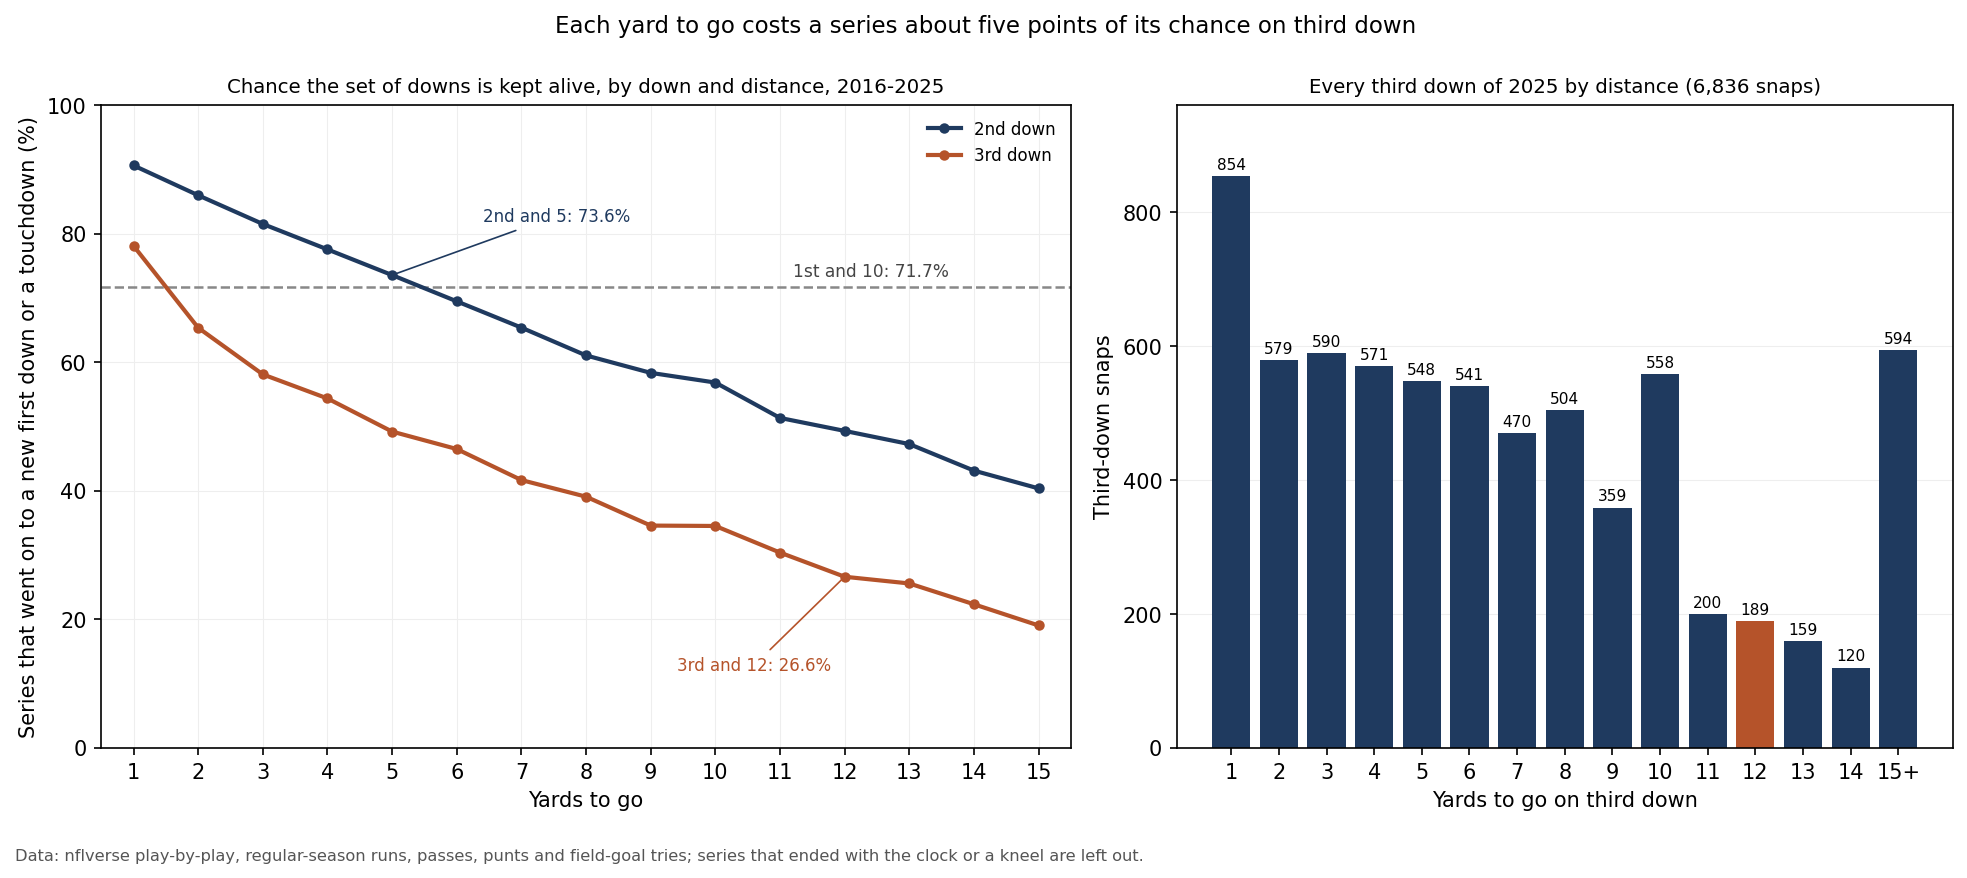
What Each Down and Distance Is Worth
The table counts every run, pass, punt and field-goal try with a down from 2016 to 2025 and asks one question: did that set of downs go on to a new first down or a touchdown? It counts the series, not the single play, so a 3rd and 12 that is converted on fourth down still counts as kept alive.
| Yards to go | 2nd down: series kept alive | 3rd down: series kept alive | 3rd-down snaps |
|---|---|---|---|
| 1 | 90.6% | 78.1% | 7,923 |
| 2 | 86.0% | 65.4% | 5,655 |
| 3 | 81.5% | 58.1% | 5,415 |
| 4 | 77.6% | 54.4% | 5,593 |
| 5 | 73.6% | 49.2% | 5,679 |
| 6 | 69.5% | 46.5% | 5,430 |
| 7 | 65.4% | 41.7% | 5,042 |
| 8 | 61.1% | 39.1% | 4,493 |
| 9 | 58.4% | 34.6% | 3,828 |
| 10 | 56.8% | 34.5% | 5,917 |
| 11 to 15 | 47.3% | 25.6% | 7,919 |
| 16 or more | 31.8% | 11.9% | 4,604 |
The baseline is 1st and 10: offenses kept 71.7% of those series going. Every play after that moves the number. A first-down play that gains 5 yards leaves the offense a little better off than it started, at 2nd and 5 (73.6%); a 4-yard gain leaves it a little worse, at 2nd and 6 (69.5%). From 2nd and 10 (56.8%), it takes a 7-yard gain to come out ahead, to 3rd and 3 (58.1%), while 6 yards, to 3rd and 4 (54.4%), still falls short. Those break-even gains are a yard longer than the 40% and 60% of the distance that the success rate rule counts as a good play on first and second down.
Third down is where distance bites hardest. From 3rd and 1 to 3rd and 10 the series loses about 4.8 points of chance for every extra yard, and 3rd and 2 (65.4%) is already worse than 1st and 10. At 3rd and 12 the offense kept the series alive 26.6% of the time across 1,739 third-and-12 snaps, about one series in four, and most of the rest ended in a punt or a field-goal try. The third-down page explains conversion rate on the third-down play itself and how teams compare.
The Distances Teams Actually Face
In 2025, 12,777 of the 14,298 first-down snaps (89.4%) were 1st and 10; 930 (6.5%) were 1st and goal, 519 were longer than 10 yards, most of them 1st and 15 (245) or 1st and 20 (185) after a penalty on the offense, and 72 were shorter. Second downs averaged 7.7 yards to go and third downs 6.9, but the most common third down was 3rd and 1 (854 snaps, 12.5%), and 26.6% of third downs needed 10 yards or more. 3rd and 12 came up 189 times in 2025.
Of the 14,561 sets of downs in 2025, 70.2% ended in a new first down or a touchdown. 47.4% reached third down and 26.1% reached fourth down. Across the season, 2,928 first downs were gained on first down, 3,548 on second, 2,733 on third and 489 on fourth.
On fourth down the choice depends on the distance. Overall, teams went for it on 23.3% of fourth downs in 2025, and the rest were 1,933 punts and 978 field-goal tries. They went for it 76.3% of the time on 4th and 1 (472 snaps), but 43.6% on 4th and 2, 17.5% on 4th and 5 and 9.8% on 4th and 8. From 2016 to 2025, offenses that went for it converted 66.8% of 2,648 tries on 4th and 1 and 35.4% of 161 on 4th and 8. When going for it pays is on the fourth-down page.
1st and Goal
Inside the 10 the line to gain is the goal line, so the only way to finish the series well is a touchdown. From 1st and goal at the 1, offenses scored a touchdown on that set of downs 88.7% of the time from 2016 to 2025; the chance falls with every yard back to the 10, and at the 10, 51.0%.
| 1st and goal at | Touchdown on that set of downs | Snaps |
|---|---|---|
| the 1 | 88.7% | 1,466 |
| the 2 | 83.7% | 768 |
| the 3 | 80.6% | 799 |
| the 5 | 71.4% | 842 |
| the 10 | 51.0% | 1,014 |
The red zone page looks at touchdowns inside the 20 by team.
A Worked Example
Tennessee, behind 24-17 at home to Cleveland on October 25, 2026, had 1st and 10 at the Cleveland 45 with 3:16 left. Here is the drive in down-and-distance terms, with the 2016-2025 chance of keeping each series alive from that spot:
- 1st and 10 at the Cleveland 45 (71.7%): a 2-yard run, so 2nd and 8 (61.1%).
- An incomplete pass made it 3rd and 8 (39.1%), and a second incompletion left 4th and 8 at the 43.
- Tennessee went for it, a call made on 9.8% of 4th and 8s in 2025, and a 26-yard catch on 4th and 8 reached the 17: a new series, 1st and 10.
- A 2-yard loss made it 2nd and 12 (49.3%), and an incompletion left 3rd and 12 at the 19 (26.6%).
- An 18-yard catch to the 1 made it 1st and goal at the 1 (88.7% touchdown).
- After an incompletion, Tennessee ran it in on 2nd and goal with 1:01 left.
Two of the three series on the drive were kept alive from spots where the series survives less than half the time, which is how a late drive that looks dead on 3rd and 12 ends in the end zone.
2026 So Far
The numbers barely move from year to year. In 2026, through Sunday, October 25, offenses have kept 72.2% of 1st-and-10 series going (4,959 snaps) and 27.1% from 3rd and 12 (85), against 24.9% of 189 in 2025.
What This Page Does Not Show
- Field position and the clock. The table pools every spot on the field and every score. A 3rd and 12 at midfield in the first quarter and one at the offense's own 5 late in a game are counted together.
- Series cut short. Series that ended because the half ran out or the offense knelt are left out of the rates, since nobody was trying to move the chains.
- Fourth down in the table. The fourth-down rates on this page count only snaps where the offense ran a play; most fourth downs are punts or field-goal tries.
- Postseason games. Every figure is from the regular season.
Method and Sources
snap         = a regular-season run, pass, punt or field-goal try with a down (no-plays, kneels and spikes left out)
series       = one set of downs (nflverse series); kept alive = it ended in a new first down or a touchdown
rate         = series kept alive / snaps, by down and yards to go, pooled 2016-2025
1st and goal = goal-to-go first-down runs and passes; a touchdown on that set of downs, by yard line
2026         = the 106 games through Sunday, October 25 (the October 26 game not used)
The script make_down_distance_chart.py checks the frozen play-by-play against its recorded hash, checks that nflverse's series outcome is a new first down or a touchdown on every row it calls a success, rebuilds every rate and count on this page, replays the Tennessee drive play by play, then draws the exhibit and asserts each number, including the rules against saved copies of the sources.
Sources: nflverse play-by-play releases for 2016-2026 (pulled 12:38 am ET on October 26, 2026; 2026 limited to games through October 25). Rules, read October 26, 2026: the 2026 NFL Rulebook, Rule 3, Section 8 and Rule 7, Section 3; NFL Football Operations, terms glossary; Wikipedia, Down (gridiron football) and American football rules.
Further reading
- Third-Down Conversion Rate: what it means and the NFL average
- Fourth Down: when going for it is the better call
- Success Rate: the down-by-down yes/no verdict on every play
- Drives: how NFL drives start and end
- Red Zone Efficiency: touchdowns inside the 20
Your team
Kept in this browser only.
Pick the playoffs
Pick the games left and see both conferences’ seeds under the NFL’s tie-breakers.
Go deeper
Want the code behind these metrics? Work through the 43-chapter NFL analytics tutorial.
Browse tutorials Free tools