How much is a field goal, and how does scoring work in football?
A touchdown is worth 6 points, a field goal 3, a safety 2. In addition, after a touchdown the scoring team gets one more play, the try, worth 1 point for a kick through the uprights or 2 for a run or pass into the end zone. In the 2025 NFL regular season teams scored 12,519 points: touchdowns 66.9%, field goals 22.3%, extra points 9.7%, and two-point tries, safeties and defensive returns the last 1.2%. The only scores worth 1 point are the extra-point kick and a safety during a try, and no NFL team has finished a game with exactly 1 point since at least 1999.
Related: the extra point · field goal distance · most common final scores
Figures from nflverse play-by-play and game results, every regular-season game since 1999 and the 94 games of 2026 through Thursday, October 22, read October 25, 2026.
Points for Every Score
The values are set by the NFL rulebook (Rule 11, Section 1) and given the same way by the NFL Football Operations glossary, the NFL Play Football glossary and Wikipedia. The 2025 columns count every score of the regular season.
| Score | Points | 2025: scores | 2025: points | Share of points |
|---|---|---|---|---|
| Touchdown | 6 | 1,395 | 8,370 | 66.9% |
| Field goal | 3 | 931 | 2,793 | 22.3% |
| Extra point (kick after a touchdown) | 1 | 1,210 | 1,210 | 9.7% |
| Two-point try (run or pass after a touchdown) | 2 | 59 | 118 | 0.9% |
| Safety | 2 | 12 | 24 | 0.2% |
| Defense returns a try | 2 | 2 | 4 | under 0.1% |
- Touchdown (6). A player carries the ball across the goal line into the other team's end zone or catches it in that end zone.
- Field goal (3). A kick from the field of play over the crossbar and between the uprights. A field goal is worth 3 points; kickers made 931 of 1,088 field-goal tries in 2025 (85.6%). How the chance falls with distance is on the field goal distance page.
- Safety (2). The defense scores when the player with the ball is tackled in, or runs or fumbles out of, his own end zone. It is also a safety if the offense commits a penalty in its own end zone.
- The try (1 or 2). After a touchdown the scoring team chooses a kick, snapped from the 15-yard line, or a run or pass from the 2. The extra point page has the distances and how often each works.
- Points for the defense during a try (2). Since 2015, a defense that returns a blocked kick or a failed two-point try into the other end zone scores 2.
- One-point safety (1). If a try ends in what would ordinarily be a safety, the other team is awarded 1 point. The rulebook allows it against either team.
The Exhibit
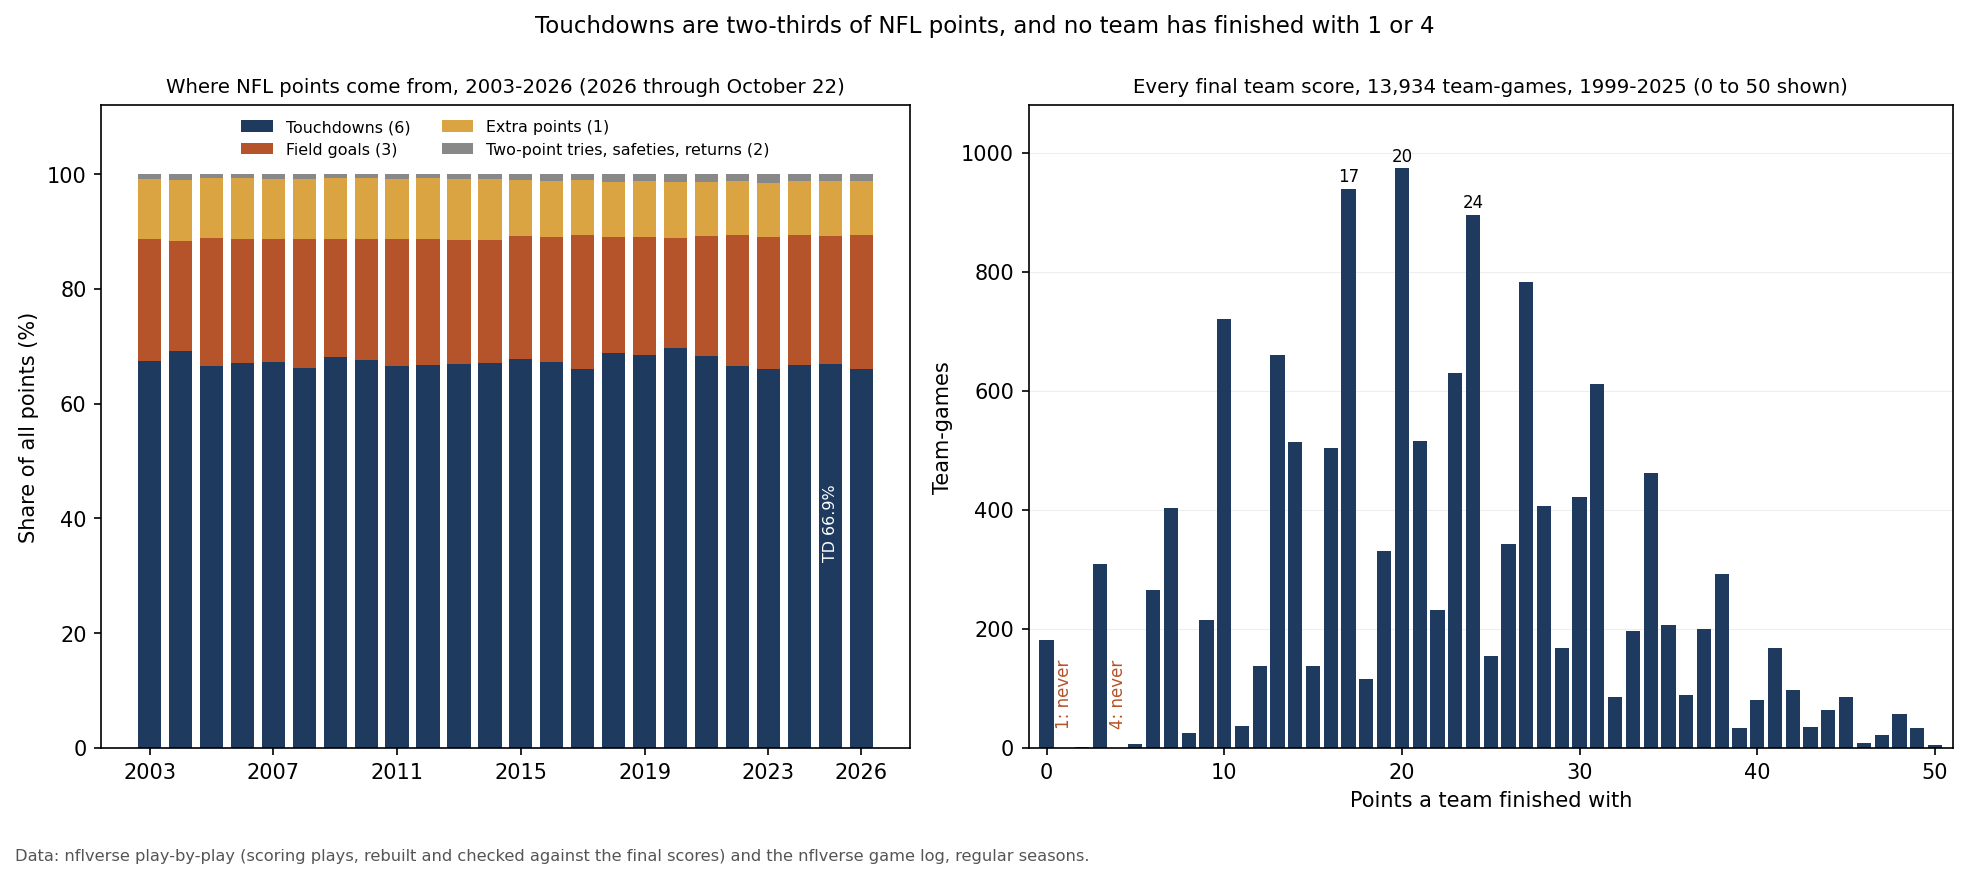
Where the Points Come From
| Season | Points per team per game | Touchdowns | Field goals | Extra points | Everything else |
|---|---|---|---|---|---|
| 2003 | 20.8 | 67.4% | 21.3% | 10.4% | 0.9% |
| 2008 | 22.0 | 66.3% | 22.5% | 10.4% | 0.9% |
| 2013 | 23.4 | 67.0% | 21.6% | 10.5% | 0.9% |
| 2018 | 23.3 | 68.8% | 20.1% | 9.7% | 1.3% |
| 2020 | 24.8 | 69.6% | 19.2% | 9.8% | 1.4% |
| 2023 | 21.8 | 66.0% | 23.1% | 9.5% | 1.5% |
| 2025 | 23.0 | 66.9% | 22.3% | 9.7% | 1.2% |
| 2026 (through Oct. 22) | 23.1 | 66.1% | 23.3% | 9.4% | 1.1% |
An NFL team scored 23.0 points a game in 2025: 2.56 touchdowns and 1.71 field goals, plus the tries. Touchdowns with their tries made up 77.5% of the points, kicks 32.0% (field goals and extra points together, the same figure as on the special teams page). Of the 1,395 touchdowns, 811 were passing touchdowns (58.1%), 510 rushing (36.6%) and 74 (5.3%) came on returns and recoveries of interceptions, fumbles, kicks and punts, 21 of them on punt and kickoff returns.
The mix barely moves. Touchdowns have been between 66.0% (2023) and 69.6% (2020) of all points in every season since 2003, and field goals between 19.2% (2004) and 23.4% (2017). The one lasting shift came with the 2015 extra-point rule: Extra points fell from more than 10.3% of points in every season through 2014 to less than 9.9% in every season since, as more kicks missed and more teams went for two, and two-point tries rose from at most 0.7% to as much as 1.2% of points. Safeties are rare: between 8 (2021) and 24 (2020) a season since 2003, 12 in 2025. Defenses have scored 15 two-point returns since that became legal in 2015. Through October 22, 2026 teams have scored 4,348 points, 23.1 a game, 66.1% from touchdowns and 23.3% from field goals. How the total has changed since 1999 is on the scoring trend page.
Can a Team Score 1 Point?
The only scores worth 1 point are the extra-point kick and a safety during a try. The kick needs a touchdown first, so a team that kicks one already has at least 7. The one-point safety is the only single point that does not need a touchdown first, and only for the defense: if a try ends in what would ordinarily be a safety against the team that just scored, the defense gets 1 point. Wikipedia's safety article describes that defensive one-point safety as the only way a team could finish with exactly 1 point, and says it has never happened.
The results agree. No team has finished an NFL game with 1 point in any of the 13,934 team scores from 1999 to 2025, and none of the tries in the play-by-play since 1999 ended in a one-point safety. In fact every team score from 0 to 59 has happened except 1 and 4. A 4 needs two 2-point scores and nothing else, such as two safeties, or a field goal plus a defensive one-point safety. 2 has happened twice, Jacksonville in 2013 and Houston in 2024, each from a single safety, and 5 six times, each a field goal and a safety. The most common team score is 20 (974 times, 7.0%), then 17 (940) and 24 (896); the most common final scores for both teams together are on the common scores page.
What This Page Does Not Show
- Before 2003 for the mix. The play-by-play for 1999-2002 does not add up to the final scores in some games (team codes and scoring credits in a number of games), so the share of points by type starts in 2003. The team scores from 1999 come from the game results, not the play-by-play.
- Postseason games. Every figure is from the regular season.
- Other leagues. College and high school use different try rules; this page is about the NFL.
- Penalties that wipe out scores. A score cancelled by a penalty is not counted.
Method and Sources
points by type = every scoring play in nflverse play-by-play: touchdown 6, field goal made 3, extra point good 1,
                 two-point try converted 2, defensive return of a try 2, safety 2 (to the team whose score rose)
check          = rebuilt points per team per game vs the final score in the game log
share          = points of one type / all points, per regular season; 2026 = the 94 games through Oct. 22
team scores    = every final score of every regular-season game, 1999-2025, from the nflverse game log
The script make_scoring_chart.py checks the frozen files against their recorded hashes, rebuilds every team's points game by game from the play-by-play and checks them against the final scores (they match the final scores on 11,932 of 11,934 team-games from 2003 to 2025 and on all 2,362 since 2022; the two that do not are one 2011 game in which the play-by-play repeats a touchdown for each team), then draws the exhibit and asserts each number on this page, including the point values against saved copies of the sources.
Sources: nflverse play-by-play releases for 1999-2026 and the nflverse game log (pulled 8:20 pm ET on October 25, 2026; 2026 limited to games through October 22). Point values, read October 25, 2026: the 2026 NFL Rulebook, Rule 11, Sections 1 and 3; NFL Football Operations, terms glossary; NFL Play Football, tackle football glossary; Wikipedia, Touchdown, Field goal, Safety (gridiron football score) and Conversion (gridiron football).
Further reading
- The NFL Extra Point: distance, success rate and the 2015 rule
- Field Goal Distance: how far kicks are and how often they go in
- Most Common NFL Scores: the final scores that keep coming up
- Scoring Trend: is the NFL higher-scoring than it used to be
- Two-Point Conversion Decisions: when to go for two
Your team
Kept in this browser only.
Pick the playoffs
Pick the games left and see both conferences’ seeds under the NFL’s tie-breakers.
Go deeper
Want the code behind these metrics? Work through the 43-chapter NFL analytics tutorial.
Browse tutorials Free tools