Who leads the NFL in EPA per play after week 7?
San Francisco leads the league in net EPA per play after week 7 at +.193, offense minus defense. Buffalo has the best offense (+.206) and the worst defense, and Minnesota, 6-0, the best defense (-.220). Seven games in, though, EPA per play is still not the best guide to the rest of a season: across 768 team-seasons from 2002 to 2025, seven-game net EPA tracked the rest-of-season win share at .407, against .441 for point margin and .401 for the record.
Related: expected points · how EPA is calculated · success rate
Figures from nflverse play-by-play and game log: the 107 games of 2026 through Monday, October 26 (week 7 complete), and every regular season from 2002 to 2025, read October 27, 2026.
Seven Weeks of Plays
Expected points added asks how much each snap changed a team's scoring outlook, given the down, the distance and the field position before and after it. Averaged over every run and pass, it ranks offenses and defenses on a per-play scale. Through week 7 of 2026 the league has run 13,857 such plays, and they averaged +.012 EPA per play with a success rate of 43.7% (a play counts as a success when its EPA is above zero). Byes mean ten teams have played six games and the other 22 seven; the rates are per play, so the extra game only adds sample.
On net, San Francisco (+.193) leads Kansas City (+.144), Cincinnati (+.141), Jacksonville (+.130) and Minnesota (+.125). The bottom five are Arizona, Tennessee, the Chargers, Miami and Philadelphia (-.188). The order has held fairly well since the week-5 rankings: recomputed from the same play-by-play, the net order after week 5 and the order now correlate at .88. Four of the five leaders then are still in the top five; Cincinnati, sixth after week 5, is third, and Baltimore has fallen from fifth to tenth. Across all 32 teams the net EPA order and the point-margin order agree at .92.
The Exhibit
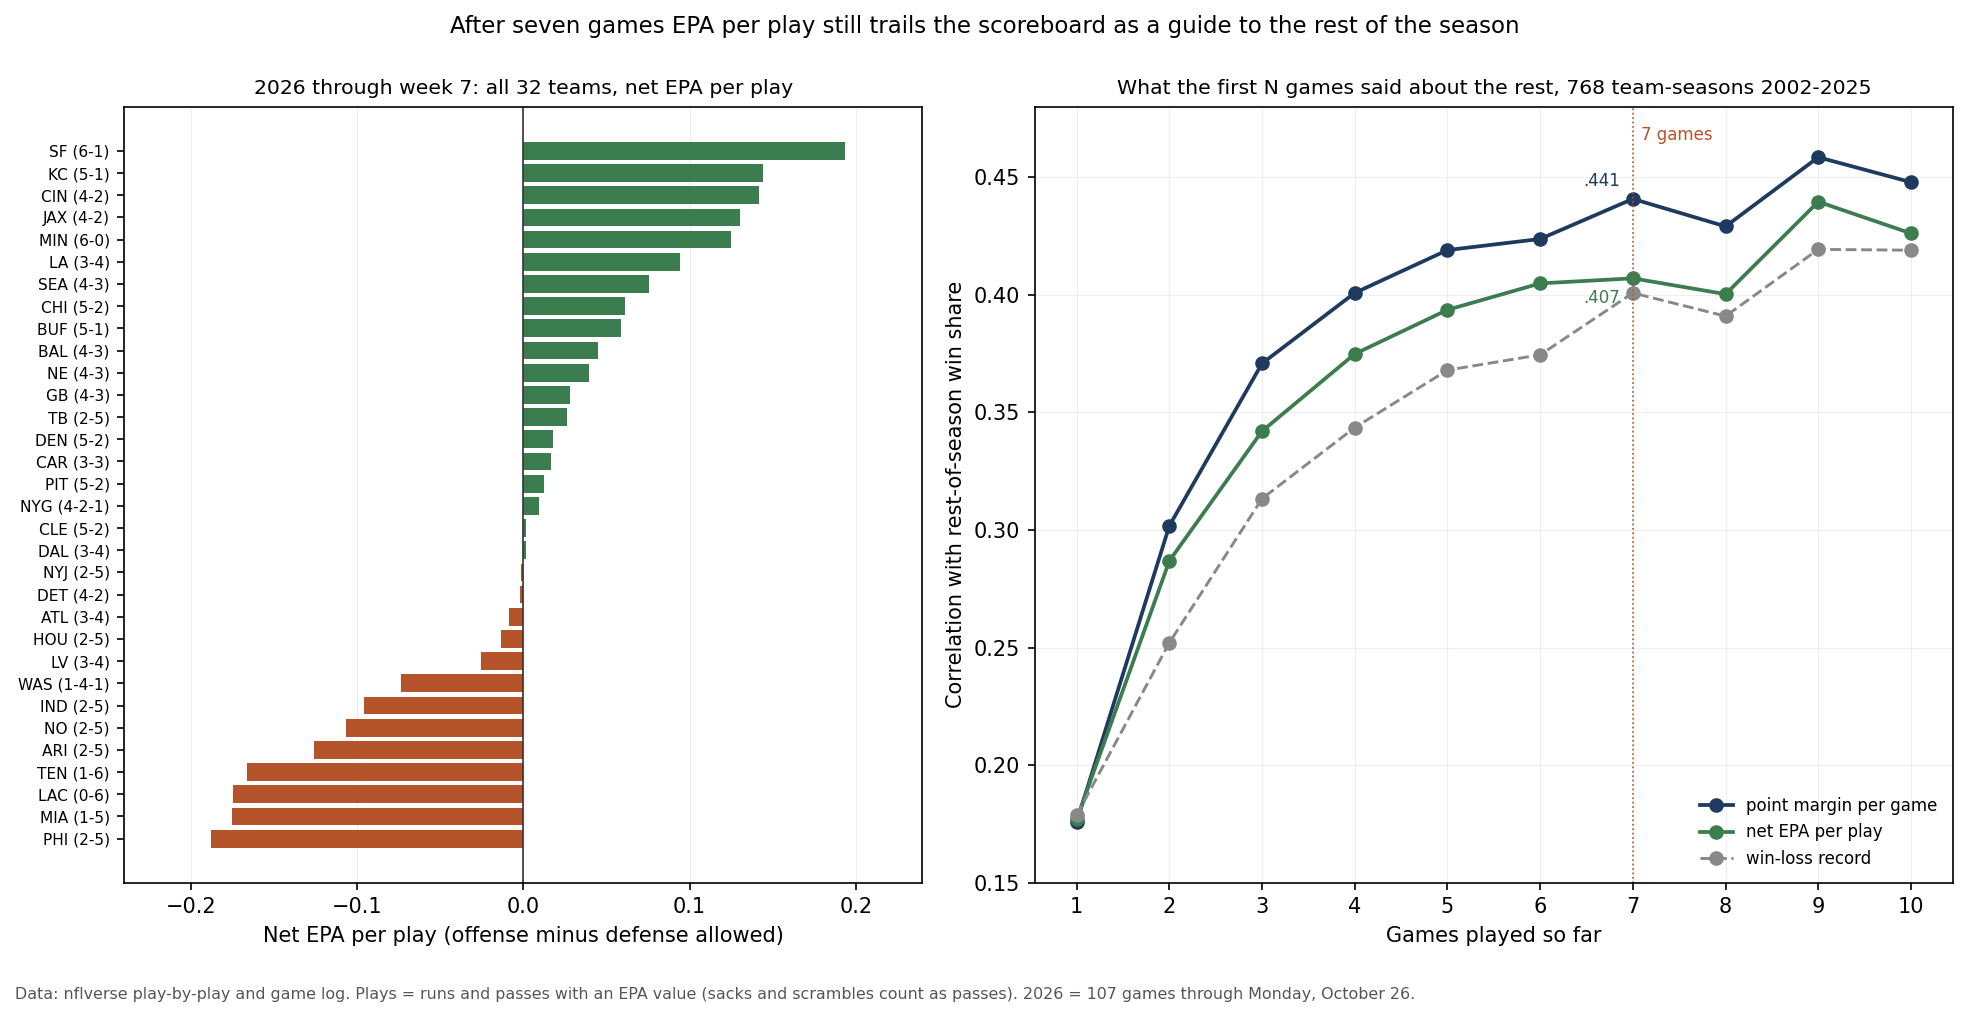
NFL EPA per Play Rankings After Week 7
Ranked by net EPA per play. Offense columns are EPA per play and success rate; defense columns are what opponents gained per play against the team, so lower is better. The figure in brackets is the rank among the 32 teams.
| Net rank | Team | W-L-T | Offense EPA/play | Offense success | Defense EPA/play | Defense success | Net |
|---|---|---|---|---|---|---|---|
| 1 | San Francisco | 6-1 | +.156 (2) | 52.6% | -.038 (9) | 43.7% | +.193 |
| 2 | Kansas City | 5-1 | +.101 (7) | 46.5% | -.043 (5) | 41.1% | +.144 |
| 3 | Cincinnati | 4-2 | +.108 (6) | 48.6% | -.033 (11) | 43.6% | +.141 |
| 4 | Jacksonville | 4-2 | +.114 (5) | 46.7% | -.016 (14) | 42.8% | +.130 |
| 5 | Minnesota | 6-0 | -.096 (30) | 36.8% | -.220 (1) | 33.8% | +.125 |
| 6 | The Rams | 3-4 | +.055 (9) | 48.8% | -.039 (7) | 43.1% | +.094 |
| 7 | Seattle | 4-3 | -.039 (25) | 42.5% | -.115 (2) | 36.6% | +.075 |
| 8 | Chicago | 5-2 | +.052 (11) | 47.0% | -.009 (15) | 41.5% | +.061 |
| 9 | Buffalo | 5-1 | +.206 (1) | 49.1% | +.148 (32) | 48.7% | +.059 |
| 10 | Baltimore | 4-3 | +.071 (8) | 46.2% | +.026 (20) | 44.1% | +.045 |
| 11 | New England | 4-3 | +.054 (10) | 45.1% | +.015 (16) | 43.5% | +.040 |
| 12 | Green Bay | 4-3 | +.001 (17) | 38.9% | -.027 (12) | 45.8% | +.028 |
| 13 | Tampa Bay | 2-5 | -.081 (28) | 40.9% | -.108 (3) | 41.2% | +.026 |
| 14 | Denver | 5-2 | -.032 (23) | 38.3% | -.049 (4) | 39.8% | +.018 |
| 15 | Carolina | 3-3 | +.041 (12) | 42.9% | +.025 (19) | 43.9% | +.017 |
| 16 | Pittsburgh | 5-2 | -.029 (20) | 42.3% | -.041 (6) | 41.9% | +.012 |
| 17 | The Giants | 4-2-1 | +.028 (14) | 43.0% | +.018 (18) | 43.4% | +.010 |
| 18 | Cleveland | 5-2 | -.037 (24) | 42.8% | -.039 (8) | 41.9% | +.002 |
| 19 | Dallas | 3-4 | +.141 (4) | 48.8% | +.140 (30) | 47.5% | +.002 |
| 20 | The Jets | 2-5 | +.014 (15) | 44.8% | +.016 (17) | 45.3% | -.002 |
| 21 | Detroit | 4-2 | +.144 (3) | 49.9% | +.146 (31) | 46.1% | -.002 |
| 22 | Atlanta | 3-4 | -.030 (21) | 44.8% | -.022 (13) | 43.4% | -.008 |
| 23 | Houston | 2-5 | +.033 (13) | 43.5% | +.047 (24) | 41.9% | -.014 |
| 24 | The Raiders | 3-4 | +.013 (16) | 42.9% | +.038 (22) | 47.0% | -.025 |
| 25 | Washington | 1-4-1 | -.007 (18) | 41.3% | +.067 (25) | 47.6% | -.074 |
| 26 | Indianapolis | 2-5 | -.063 (27) | 42.5% | +.032 (21) | 42.4% | -.096 |
| 27 | New Orleans | 2-5 | -.030 (22) | 41.9% | +.076 (26) | 48.9% | -.106 |
| 28 | Arizona | 2-5 | -.024 (19) | 44.6% | +.102 (28) | 44.4% | -.126 |
| 29 | Tennessee | 1-6 | -.121 (31) | 40.3% | +.045 (23) | 44.5% | -.166 |
| 30 | The Chargers | 0-6 | -.209 (32) | 36.9% | -.034 (10) | 43.4% | -.174 |
| 31 | Miami | 1-5 | -.046 (26) | 40.0% | +.129 (29) | 49.2% | -.175 |
| 32 | Philadelphia | 2-5 | -.086 (29) | 37.3% | +.102 (27) | 45.8% | -.188 |
Where EPA and the Standings Disagree
Minnesota is 6-0 with an offense 30th in EPA per play (-.096) and last in success rate. Its defense is first by a distance, the team is first in point margin, and the net still puts it fifth. Buffalo is the mirror image at 5-1: the best offense in the league and the worst defense, ninth on net. Detroit (third on offense, 31st on defense) and Dallas (fourth and 30th) share the shape, which leaves both near zero on net.
Cleveland is 5-2 with a net of +.002, 18th, and 22nd in point margin. Twelve team-seasons from 2002 to 2025 won at least five of their first seven games while ranking in the bottom half on net EPA, and they won 45.8% of their remaining games, against 62.6% for the 206 that won as often with a top-half net. Two other teams with winning records sit in the bottom half today, the Giants (4-2-1) and Detroit (4-2), though neither has won five. The other way round, the Rams (3-4) are sixth and Tampa Bay (2-5) 13th, on the strength of the seventh- and third-best defenses. Teams with two wins or fewer after seven games but a top-half net won 47.6% of the rest of their games from 2002 to 2025 (21 of them), against 38.3% for the 192 with a bottom-half net.
When Does EPA Catch the Scoreboard?
A common claim is that efficiency per play is a better guide to a team than its points. The test here is simple: for every team-season from 2002 to 2025, take the first N games, from one to ten, and correlate three numbers from them with the share of the remaining games the team won. The record, point margin per game and net EPA per play all improve as N grows. At no point from two games to ten did net EPA per play beat point margin. After one game the two are level (.176 and .177). At seven games net EPA scores .407, against .441 for point margin and .401 for the record, a gap of .034; at ten games it is .448 for margin and .426 for net EPA. What net EPA does do is beat the win-loss record at every count from two games to ten.
Two refinements narrow the gap without closing it. Adjusting each team's EPA for the offenses and defenses it has faced (one pass: subtract how far its opponents' defenses or offenses sit from the league average over the same games) lifts the seven-game figure to an opponent-adjusted .420, still short of the margin's .441, and the margin itself is not opponent-adjusted. And fitting combinations on every season but one and testing on the season left out, margin alone scored .438, net EPA alone .403, margin and net together .436, margin plus offensive EPA .446, and adding defensive EPA as well, .443. Offensive EPA adds a little to what the scoreboard already says; the defensive half adds nothing on top.
The reason shows when the halves are split. Seven-game offensive EPA per play correlates with the same offense's EPA over the rest of the season at .597; for defense the figure is .341 (offense .597, defense .341). Against the rest-of-season win share, offense alone scores .363 and defense -.193 (negative because lower is better). Offenses keep their level; defenses drift, so a defense-led net like Minnesota's or Tampa Bay's is the least settled kind.
What This Table Leaves Out
- Opponents. The table is raw. A defense that has faced weak offenses looks better than it is; the one-pass adjustment above helps the history only a little, and with six or seven games per team it is too noisy to publish as a ranking.
- Game state. Every run and pass counts, including plays with the result already settled. Teams protecting a big lead run more and pass less, which pulls their offensive EPA down.
- The EPA scale is nflverse's. The expected-points values come from nflverse's play-by-play; a different expected-points table would move every number a little.
- Correlation over many seasons. The .407 and .441 are averages over 768 team-seasons. They say how much a number usually carries forward, not what any one team will do.
Method and Reproducibility
play        = regular-season run or pass with an EPA value (pass == 1 or rush == 1; sacks and scrambles are passes)
EPA/play    = summed EPA / plays; success = share of plays with EPA > 0; defense = the same for opponents' plays
net         = offense EPA/play - defense EPA/play allowed
history     = 2002-2025, 768 team-seasons; first N games vs the rest (9 or 10 games after N = 7)
forecast r  = Pearson correlation with the rest-of-season win share (ties = half a win)
out-of-season fit = least squares on 23 seasons, tested on the 24th, each season in turn
2026        = 107 games through Monday, October 26 (week 7 complete)
The script make_epa_rankings_week7_chart.py checks the frozen play-by-play and game log against their recorded hashes, checks that the play-by-play holds exactly the 107 scored games, rebuilds the 32-team table and every rank, recomputes the 2002-2025 curve for each game count from one to ten, the opponent adjustment and the season-by-season fits, then draws the exhibit and asserts each number on this page. Data pulled 2:37 pm UTC on October 27, 2026.
Sources: nflverse play-by-play releases (2026 through October 26; the 2002-2025 team-game table built October 14, 2026 from the same releases) and the nflverse game log, read October 27, 2026.
Further reading
- NFL EPA Rankings After Week 5: the same table two weeks ago, and what five games were worth
- How Is EPA Calculated?: the expected-points table behind every number here
- Expected Points: what a down, distance and yard line are worth
- Success Rate: the yes-or-no version of EPA
- Pythagorean Wins: what point margin says a record should be
Your team
Kept in this browser only.
Pick the playoffs
Pick the games left and see both conferences’ seeds under the NFL’s tie-breakers.
Go deeper
Want the code behind these metrics? Work through the 43-chapter NFL analytics tutorial.
Browse tutorials Free tools