What do Comb, Solo and Asst mean in football stats?
Comb is combined tackles, the total a defender was credited with. Solo is a tackle made by one defender on his own. Asst is an assist, the credit each defender gets when two or more share a tackle. On NFL.com the three add up with one more piece, tackles made with an assist: Jordyn Brooks led the NFL in 2025 with 183 combined tackles: 96 solo, 84 assists and 3 tackles made with an assist. In the NFL, tackles are tracked as an unofficial statistic by a scorekeeper hired by the home team, and the league does not verify that the counts are accurate.
Related: NFL stat abbreviations · what is a turnover · pass protection
Figures from nflverse play-by-play and player statistics, every regular-season game from 2016 to 2025 and the 107 games of 2026 through Monday, October 26, read October 27, 2026.
How a Tackle Is Credited
NFL.com's tackle table has four columns: Comb, Asst, Solo and Sck (sacks). The first three are all tackles, counted three ways.
- Solo. One defender brings the ball carrier down by himself. In the play-by-play text his name sits alone in the brackets after the play, as in "(56-A.Highsmith)".
- Asst. Two or more defenders share the tackle, and each is credited with an assist. In the play-by-play, a semicolon between two names records two assists: 7,677 of the 7,832 shared tackles of 2025 that named no primary tackler were written that way, as in "(56-Q.Williams; 22-T.Adams)".
- Tackle with an assist. The scorer names one defender as the tackler and a second as helping. In the play-by-play that is a comma, as in "(3-K.Curl, 1-E.Forbes)": the first name gets the tackle and the second an assist. It happened 683 times in 2025, and every one of those plays was written that way.
- Comb. NFL.com labels its total column Comb (its sort link reads defensivecombinetackles), and on its 2025 table Comb equals Solo plus Asst plus the tackles made with an assist, for every row. Brooks's 183 is 96 + 84 + 3.
Those totals are not the league's official numbers in the way points and yards are. Wikipedia's article on the tackle, citing a 2012 Wall Street Journal report titled "The NFL's Make-Believe Stat", says that in the NFL tackles are tracked as an unofficial statistic by a scorekeeper hired by the home team, and that the league does not verify that the counts are accurate. The league's official statistician is the Elias Sports Bureau, which serves Major League Baseball and the NBA in the same role. The rest of this page checks what that arrangement does to the numbers.
The 2025 Tackle Leaders
The 2025 regular season produced 36,710 combined tackles: 19,678 solo tackles, 16,349 assists and 683 tackles with an assist, from nflverse's player statistics. They came on 28,115 plays with at least one tackle credit, 2,838 of them on special teams. The same season had 2,589 tackles for loss and 3,038 quarterback hits.
| Player | Team | Comb | Solo | Asst | With assist |
|---|---|---|---|---|---|
| Jordyn Brooks | MIA | 183 | 96 | 84 | 3 |
| Jack Campbell | DET | 176 | 87 | 87 | 2 |
| Devin White | LV | 174 | 90 | 79 | 5 |
| Cedric Gray | TEN | 164 | 94 | 67 | 3 |
| Bobby Wagner | WAS | 162 | 75 | 83 | 4 |
| Carson Schwesinger | CLE | 156 | 58 | 89 | 9 |
| Nick Bolton | KC | 154 | 69 | 81 | 4 |
| Jamien Sherwood | NYJ | 154 | 68 | 83 | 3 |
| Blake Cashman | MIN | 144 | 60 | 83 | 1 |
| Bobby Okereke | NYG | 143 | 75 | 65 | 3 |
All ten are linebackers. Two sources agree on these lines almost to the tackle: NFL.com's own 2025 table lists 25 players, and 24 of its 25 rows match the nflverse player statistics exactly on all three columns. The one exception is Carson Schwesinger, with 90 assists to nflverse's 89, which is why his NFL.com total is 157 against 156 here.
Where the tackle happens matters as much as how many. On 2025 scrimmage plays, the average gain on a play where a defensive back was credited with a tackle or assist was 9.3 yards (median 7), across 13,729 credits, 60.8% of them on passes. For linebackers it was 4.6 yards (11,589 credits) and for defensive linemen 1.9 yards (7,248). A cornerback who makes a lot of tackles is often a cornerback whose receiver caught the ball. A tackle total counts involvement, not stops.
The Exhibit
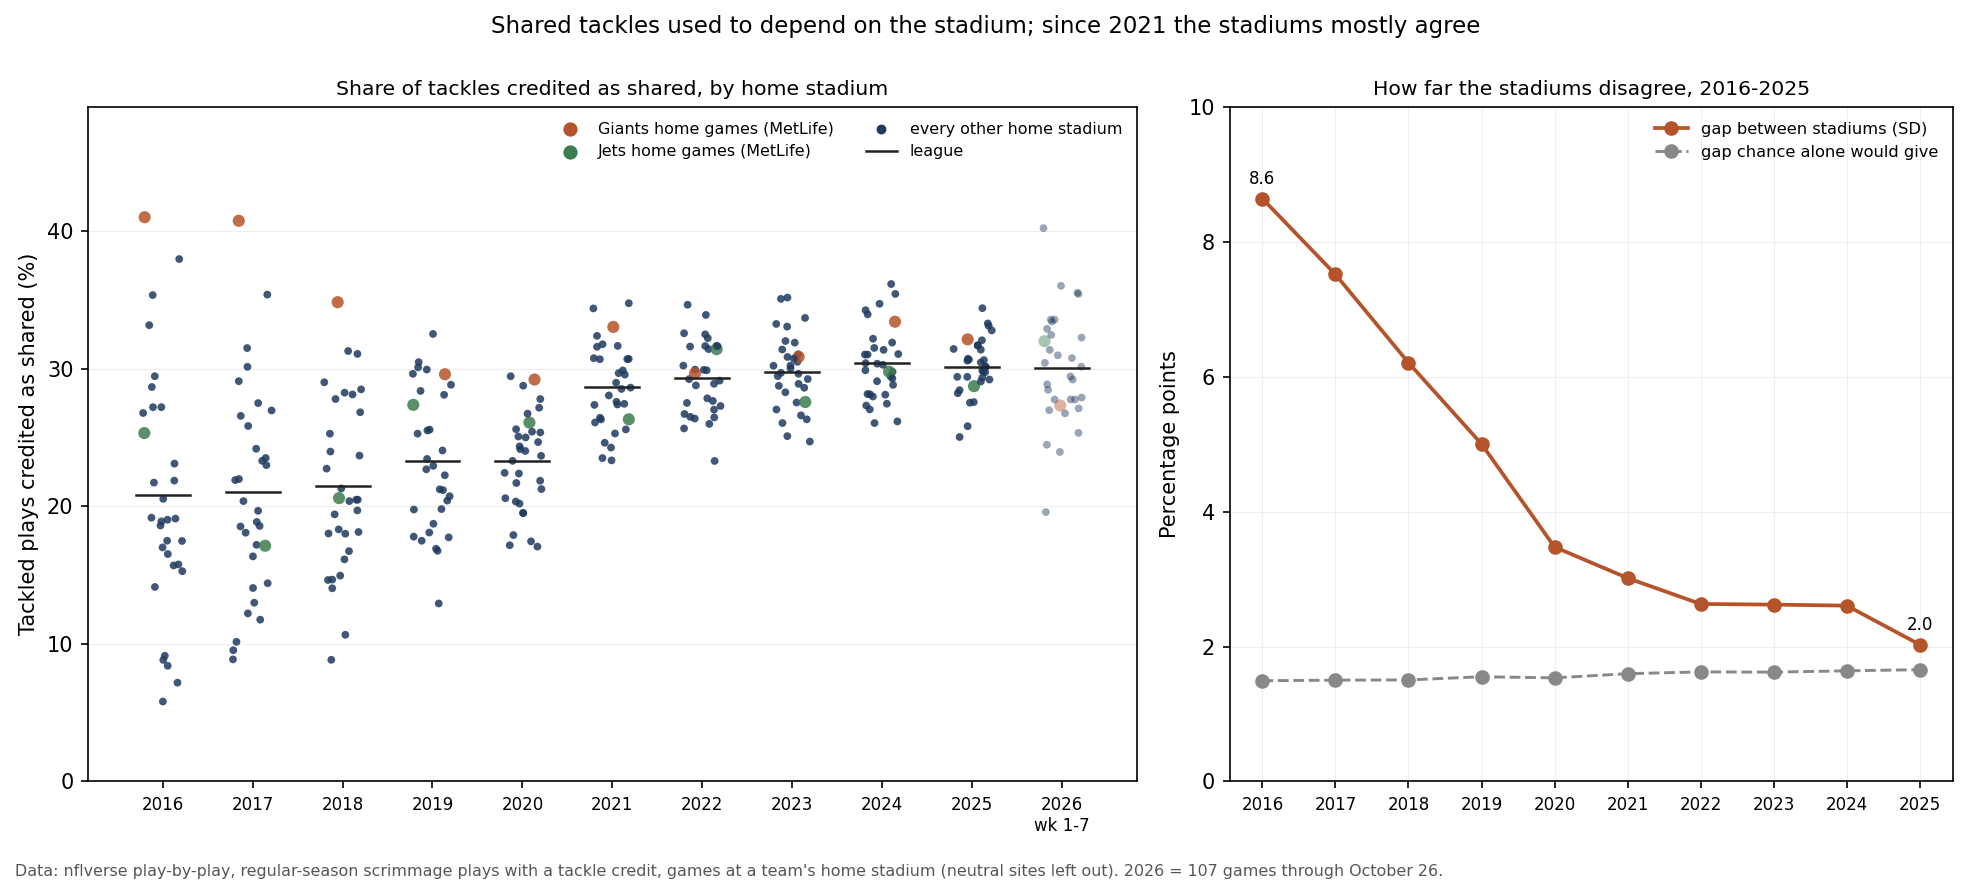
Tackles Used to Depend on the Stadium
If a home-team scorekeeper decides whether a pile-up counts as one solo tackle or two assists, then the share of shared tackles should vary by stadium, and it should vary the same way for both defenses on the field, because the same person scores both. It did, and by a lot.
In 2016 the share of tackled scrimmage plays credited as shared ran from 5.8% of tackled plays in Jacksonville to 41.0% in Giants home games. The gap between the 32 home stadiums, measured as a standard deviation, was 8.6 percentage points, where chance alone would give about 1.5 with roughly 740 tackled plays per stadium. And the visiting defenses moved with the home defense: across the 32 stadiums the shared share of the home team's defense and that of its visitors correlated at +0.85 in 2016 and +0.91 in 2017. A visiting defense does not bring its own scoring style to a road game. It gets the home scorer's.
The Giants and the Jets make the cleanest test, because they share a building. In 2017, Giants home games at MetLife Stadium credited a shared tackle on 40.3% of the Giants' own tackled plays and 41.2% of the visitors'. Jets home games in the same stadium credited 16.1% and 18.0%. The Giants' defense itself was at 23.7% on the road that season, close to the league's 21.0%. Same field, same season, two home teams and two very different rates, which points at the people keeping score rather than at the stadium. The same order held in all three seasons from 2016 to 2018.
That gap reaches individual lines. Because a shared tackle gives each defender a credit, a scorer who records more assists hands out more total credits. In 2017 the Giants' home games produced 1.42 tackle credits per tackled play, against 1.18 in Jets home games and 1.10 at the lowest stadium. A linebacker with eight home games at the high end gets more combined tackles for the same plays.
| Season | League | Lowest to highest stadium | Gap (SD) | Chance alone | Home vs visitors |
|---|---|---|---|---|---|
| 2016 | 20.8% | 5.8% to 41.0% | 8.6 | 1.5 | +0.85 |
| 2017 | 21.0% | 8.9% to 40.8% | 7.5 | 1.5 | +0.91 |
| 2018 | 21.5% | 8.8% to 34.8% | 6.2 | 1.5 | +0.78 |
| 2019 | 23.3% | 12.9% to 32.5% | 5.0 | 1.6 | +0.61 |
| 2020 | 23.3% | 17.1% to 29.4% | 3.5 | 1.5 | +0.55 |
| 2021 | 28.6% | 23.3% to 34.8% | 3.0 | 1.6 | +0.31 |
| 2022 | 29.3% | 23.3% to 34.6% | 2.6 | 1.6 | +0.19 |
| 2023 | 29.8% | 24.7% to 35.2% | 2.6 | 1.6 | +0.14 |
| 2024 | 30.4% | 26.0% to 36.2% | 2.6 | 1.6 | +0.26 |
| 2025 | 30.1% | 25.0% to 34.4% | 2.0 | 1.7 | -0.01 |
Since 2021 the Stadiums Mostly Agree
The gap closed over four seasons. It fell from 8.6 points in 2016 to 3.5 in 2020, and it has been between 2.0 points in 2025 and 3.0 since 2021, not far above what chance alone would give. The home-versus-visitors correlation went from +0.91 in 2017 to -0.01 in 2025, and a stadium's rate one season no longer says much about the next (.80 from 2016 to 2017, .26 from 2024 to 2025). In 2025 the stadiums ran from 25.0% in Buffalo to 34.4% in Washington.
At the same time the league's rate of shared tackles went up, from 20.8% in 2016 to 28.6% in 2021, and it was 30.1% in 2025 and 30.0% through week 7 of 2026. The data cannot say why. It shows the stadiums converging on a common, higher rate of assists; it does not show a rule change, and no source read for this page describes one. What it does show is when tackle totals became comparable across teams: a 2025 line is far less tied to the home schedule than a 2016 line was, and a career total that runs across 2016 to 2021 mixes the two eras.
Passes Defended and Pass Breakups
Wikipedia's article on the pass deflection lists the names for the same thing: a pass deflected, a pass defended, a pass defensed, a pass knockdown or a pass breakup, meaning an incomplete pass caused by a defensive player. nflverse's player statistics define the column as passes defended or broken up.
In practice the count also includes interceptions. In 2025 defenders were credited with 2,357 passes defended, and all 380 interceptions carried a pass defense for the player who made the interception. A pass defense was credited on 1,874 of the 5,842 incomplete passes (32.1%); the rest named no defender. Mike Jackson and Riley Moss led with 19 each, Jackson with 4 of his as interceptions and Moss with 1.
What Tackle Numbers Can't Tell You
- They are unofficial. The counts come from the home team's scorekeeper and the league does not verify them. NFL.com and nflverse agree almost exactly, but that is two copies of the same scoring, not two independent counts.
- Volume is not quality. A defender on the field for more snaps, on a defense that faces more plays, gets more chances. In 2025 the plays on which a defensive back made or shared the tackle gained 9.3 yards on average.
- A missed tackle is invisible. The play-by-play credits whoever finished the play. Nothing in these columns records the defender who had the ball carrier first and lost him.
- Era matters. In 2017 the two home teams at MetLife Stadium credited shared tackles 24 percentage points apart. Compare tackle totals across those seasons with that in mind, and compare assists most carefully of all.
- The parsing is nflverse's. Credits come from nflverse's reading of the play descriptions. On 481,511 rows from 2016 to 2026, four plays flag a solo tackle without naming the tackler and one flags an assist without a name; for 2025 the play-by-play gives 19,677 solo credits against 19,678 in the player statistics.
Method and Reproducibility
tackled play   = regular-season scrimmage play (special_teams_play 0, not deleted) with at least one named
                 solo tackle, assist or tackle-with-assist credit
shared         = the play credits at least one assist (assist_tackle_1_player_id is named)
stadium        = the home team of a game at its home stadium (nflverse location "Home"); neutral sites left out
gap (SD)       = standard deviation of the 32 stadium shares; chance alone = sqrt(mean(p(1-p)/n)) at the league rate p
home vs visitors = correlation, across the 32 stadiums, of the home defense's shared share and its visitors'
Comb           = solo + assists + tackles with an assist (nflverse def_tackles_solo + def_tackle_assists +
                 def_tackles_with_assist), checked against NFL.com's 2025 table
2026           = the 107 games through Monday, October 26 (week 7 complete)
The script make_tackle_stats_chart.py checks the frozen files against their recorded hashes, checks every play-by-play tackle and pass-defense credit against the player statistics, reads the semicolon and comma notation off every 2025 play description, rebuilds the stadium table and the shared-stadium comparison, compares the NFL.com table row by row, then draws the exhibit and asserts each number on this page, including the definitions against saved copies of the sources. The data was frozen at 2:37 pm UTC on October 27, 2026.
Sources: nflverse play-by-play releases for 2016-2026 and player statistics for 2025, with the nflverse data dictionaries for play-by-play and player statistics; NFL.com, 2025 tackles; Wikipedia, Tackle (football move), Pass deflection and Elias Sports Bureau. All read October 27, 2026.
Further reading
- NFL Stat Abbreviations: ATT, LNG, PCT and the rest of a box score
- What Is a Turnover?: interceptions, lost fumbles and what they cost
- Pass Protection: sacks, pressure and who is to blame
- Pass-Rush Pressure Rate: the defensive stat that predicts sacks
- What Is YAC?: the yards a receiver adds before the tackle
Your team
Kept in this browser only.
Pick the playoffs
Pick the games left and see both conferences’ seeds under the NFL’s tie-breakers.
Go deeper
Want the code behind these metrics? Work through the 43-chapter NFL analytics tutorial.
Browse tutorials Free tools