What is predictive analytics in the NFL?
Predictive analytics uses what has already happened to forecast what will. In the NFL the first question is which numbers are worth forecasting from, and two tests answer it: does the stat repeat, and does it say anything about later wins? Across 767 team-seasons from 2002 to 2025, offensive EPA per play repeated best (a split-half correlation of .634), and after eight games point margin per game was the best guide to the rest of the season (.461 against the rest-of-season win share), ahead of net EPA per play (.447) and the win-loss record (.419). Fumble recovery rate (-.041), field goal percentage (.066) and the record in one-score games (.092) barely repeat at all: in a season's worth of games they are mostly luck.
Related: turnovers and luck · close-game luck · Pythagorean wins
Figures from nflverse play-by-play, team stats and game log for the 2002-2025 regular seasons, read October 28, 2026. No 2026 game is used.
Two Tests Every Stat Has to Pass
Predictive analytics, in the general definition, takes in the statistical techniques that analyze current and historical facts to make predictions about future or otherwise unknown events. Applied to football, the hard part is rarely the technique. It is choosing inputs. A box score is full of numbers that describe a game perfectly and forecast the next one badly, because they rest on a handful of bounces rather than on hundreds of plays.
So each team stat here has to pass two tests before it is worth predicting with.
- Does it repeat? Split every team-season into its odd-numbered games (1st, 3rd, 5th...) and its even-numbered games, compute the stat for each half, and correlate the two halves across all 767 team-seasons. Both halves come from the same team, the same roster and the same months, so a stat that measures something real about the team should agree with itself. A stat driven by chance will not. This is the split-half method psychometricians use to estimate how reliable a test is.
- Does it matter? Take the stat over a team's first eight games and correlate it with the share of its remaining games the team won (eight or nine games, depending on the season length). A stat can repeat and still say little about winning.
A third column in the table, the same franchise's figure the next season, shows how much survives an offseason of roster turnover. The data are nflverse's public play-by-play (expected points added and success for every run and pass), its team-game stats (interceptions, fumbles, sacks, penalties, field goals) and its game log for scores, for every regular season from 2002 to 2025.
The Exhibit
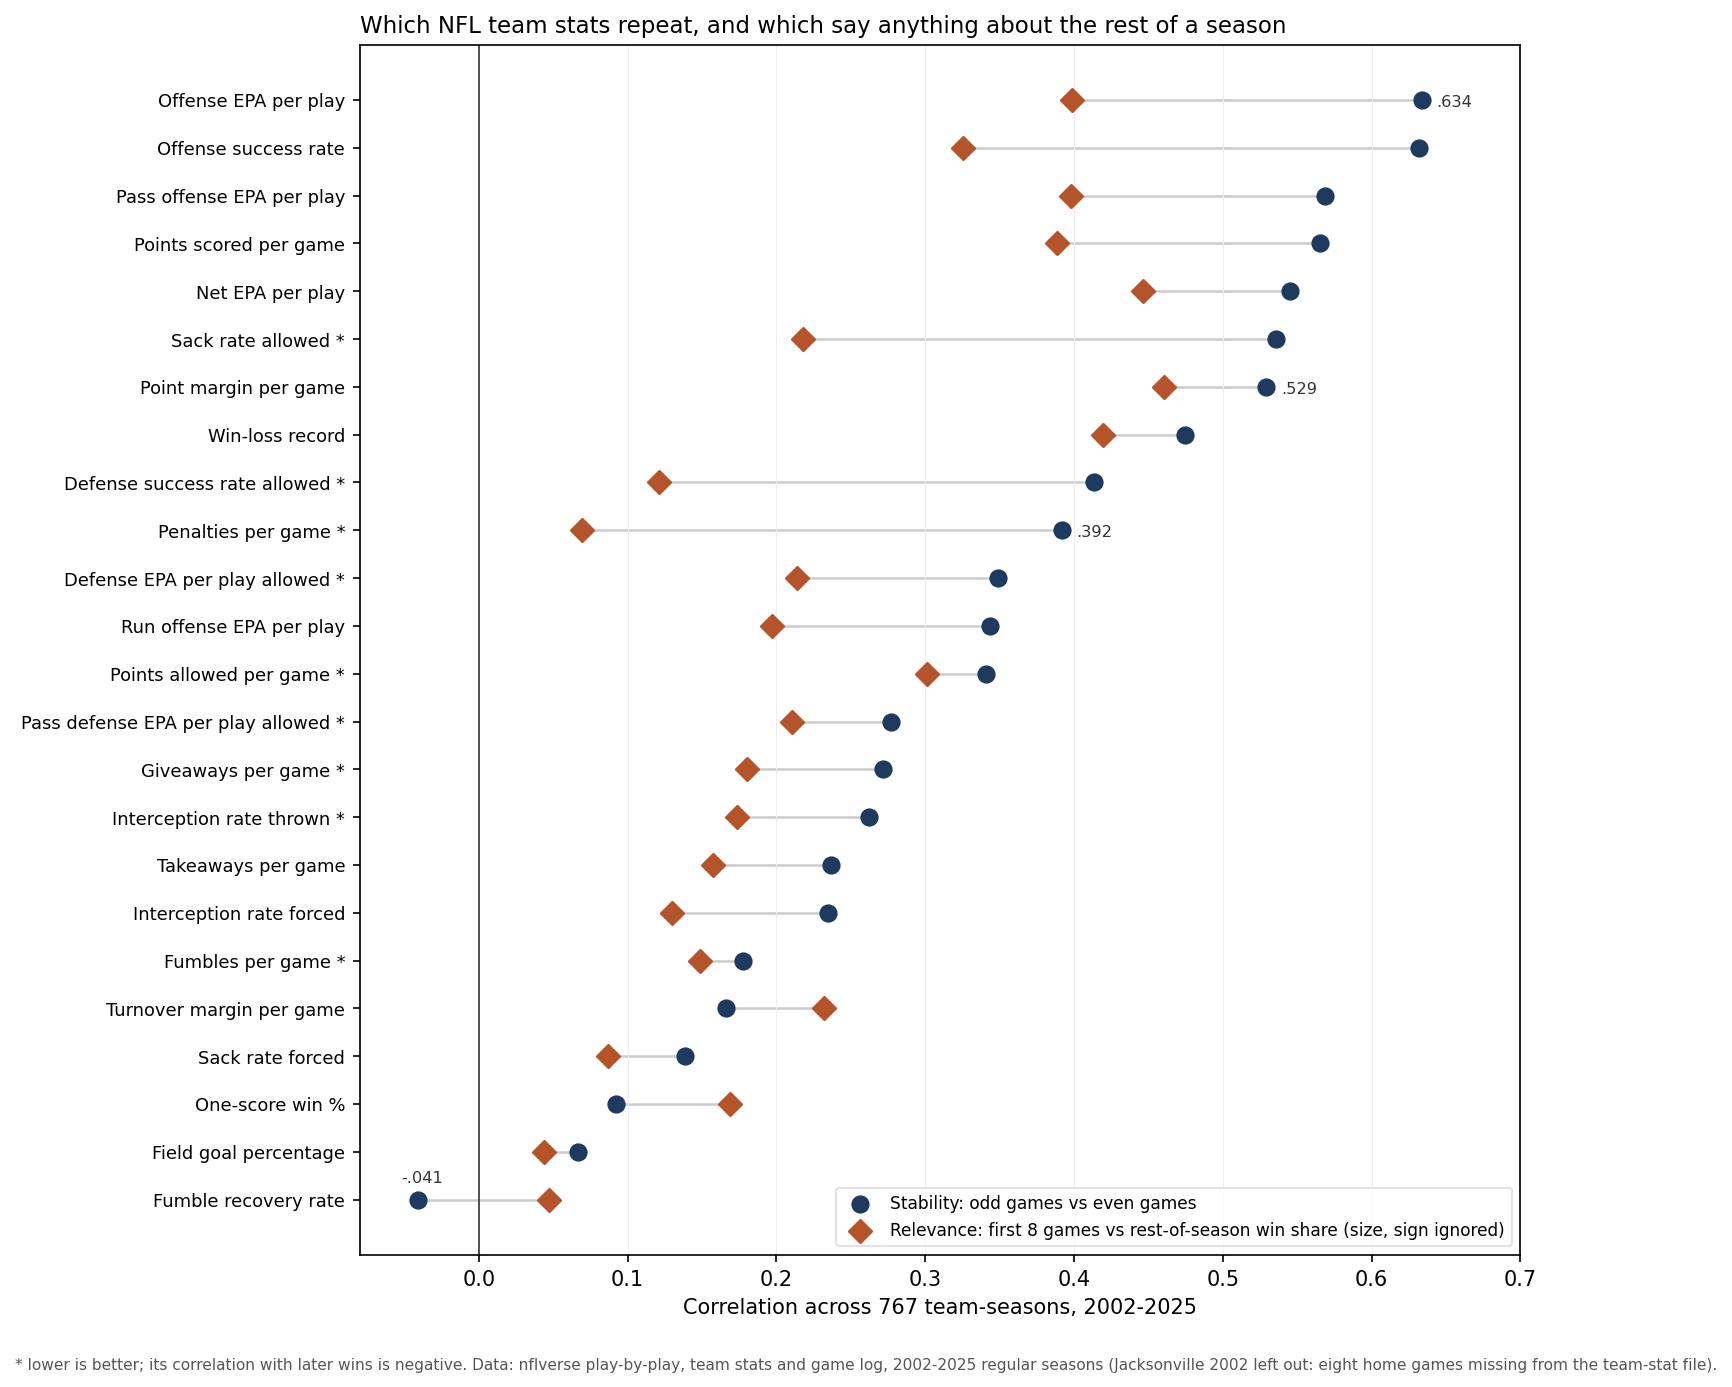
Which NFL Stats Predict Wins: The Full Table
Sorted by the split-half correlation. "Games for .5" is how many games of data the stat needs before half of the variation between teams is signal (see the worked example below). The forecast column is the first eight games against the rest-of-season win share; a starred, lower-is-better stat correlates negatively when it helps. The last column is season to next season.
| Team stat | Odd vs even games | Games for .5 | First 8 games vs rest-of-season wins | Next season |
|---|---|---|---|---|
| Offense EPA per play | .634 | 4.7 | .399 | .447 |
| Offense success rate | .632 | 4.7 | .325 | .473 |
| Pass offense EPA per play | .568 | 6.2 | .398 | .446 |
| Points scored per game | .566 | 6.2 | .388 | .418 |
| Net EPA per play | .545 | 6.8 | .447 | .419 |
| Sack rate allowed * | .536 | 7.0 | -.218 | .408 |
| Point margin per game | .529 | 7.2 | .461 | .409 |
| Win-loss record | .474 | 9.0 | .419 | .332 |
| Defense success rate allowed * | .413 | 11.5 | -.121 | .365 |
| Penalties per game * | .392 | 12.6 | -.069 | .436 |
| Defense EPA per play allowed * | .349 | 15.1 | -.214 | .281 |
| Run offense EPA per play | .344 | 15.5 | .197 | .315 |
| Points allowed per game * | .341 | 15.7 | -.301 | .329 |
| Pass defense EPA per play allowed * | .277 | 21.2 | -.210 | .258 |
| Giveaways per game * | .271 | 21.8 | -.180 | .292 |
| Interception rate thrown * | .262 | 22.8 | -.174 | .312 |
| Takeaways per game | .237 | 26.1 | .158 | .248 |
| Interception rate forced | .235 | 26.4 | .130 | .261 |
| Fumbles per game * | .177 | 37.6 | -.149 | .281 |
| Turnover margin per game | .166 | 40.7 | .232 | .114 |
| Sack rate forced | .139 | 50.3 | .087 | .193 |
| One-score win % | .092 | 79.5 | .169 | .076 |
| Field goal percentage | .066 | 113.8 | .044 | .087 |
| Fumble recovery rate | -.041 | never | -.047 | -.027 |
| Third-down conversion rate (2016-2025) | .329 | 16.5 | .319 | .380 |
| Third-down conversion rate allowed (2016-2025) * | .180 | 36.9 | -.085 | .175 |
What Repeats: Plays, Not Events
The top of the table is made of rates built on many snaps. Offenses averaged 65.1 runs and passes a game over these seasons, so eight games give each per-play rate about 520 observations. Offensive EPA per play (.634) and offensive success rate (.632) are the two most stable team stats in the set, and passing efficiency (.568) is far steadier than running efficiency (.344). Points scored per game (.566) repeats much better than points allowed (.341).
That offense-defense gap runs through the whole table. Defensive EPA per play allowed splits at .349 against .634 for offense, and the pass defense, at .277, is one of the least stable efficiency numbers. Stepped up to a full season, offensive EPA per play reaches a reliability of .776, defensive EPA .517. A defense's season-long number still means something, but much less of a half-season's defensive ranking will survive the second half. The week-7 EPA rankings show the same split from the 2026 side.
The scoreboard sits in the middle. Point margin per game splits at .529 and the win-loss record at .474. Margin repeats better than the record because every point counts in it, while a record throws away everything except which side of zero the margin landed on. The next-season column agrees (margin .409, record .332), which is the case for Pythagorean wins, built from points scored and allowed, over the record.
What Is Luck: Bounces and Close Games
The bottom of the table is made of stats that turn on a few events a game, and a team has less say over how they land. Extreme values in them are followed by values closer to the average, which is regression toward the mean in its plainest form.
- Fumble recovery rate is the share of all fumbles in a team's games that the team ended up with. Its split-half correlation is -.041, statistically nothing: a team that fell on the ball in its odd games was no more likely to do it in its even games. Offenses lost 51.1% of their own fumbles over these seasons (6,460 of 12,649), close to a coin. The 95 team-seasons in the top tenth after eight games recovered 72.2% of the fumbles in their games; over the rest of those seasons they recovered 49.4%.
- Field goal percentage splits at .066. Teams tried 1.9 field goals a game and made 83.3%, so a couple of misses move a half-season's rate a long way.
- Record in one-score games (decided by eight points or fewer) splits at .092 and carries to the next season at .076, the result the close-game luck explainer also finds. The 65 teams that won at least 80% of their one-score games in the first eight (with four or more such games) won 56.1% of their 279 close games over the rest of those seasons.
- Turnover margin splits at .166, which makes it one of the least stable stats in the set even though every turnover is a big play. Its parts are steadier than the whole: interceptions thrown per attempt (.262) and giveaways (.271) carry more signal than takeaways (.237), and fumbling itself (.177) repeats more than recovering (-.041). The 71 teams that were +1.0 a game or better after eight games averaged +1.27 in those games and +0.14 over the rest. They had won 71.0% of their first eight and won 58.4% of the rest. The turnovers and luck explainer works through why.
Turnover margin is one stat whose link to later wins (.232) is higher than its own split-half (.166). Teams that win the turnover battle tend to be good teams in other ways, so part of the margin's forecasting value is borrowed from the efficiency it travels with.
Stable, but Beside the Point
Repeating is necessary, not sufficient. Penalties per game split at .392 and carry to the next season at .436, as steady as most efficiency stats, so penalty counts are a real team trait. Their link to the rest-of-season win share is -.069, close to nothing. Sack rate allowed is the other example: very stable (.536), only moderately tied to later wins (-.218). Sack rate forced, the defensive side, barely repeats (.139).
Third-down conversion rate, measured on 2016-2025, lands in between: .329 split-half and .319 against the rest of the season for offenses, but only .180 split-half for defenses. A good third-down offense in October is more likely to be a good third-down offense in December than a good third-down defense is. The third-down explainer breaks the rate down by distance.
Worked Example: How Many Games Before a Stat Means Something
A split-half correlation measures the reliability of half a season. The Spearman-Brown formula, published independently by Spearman and by Brown in 1910 to predict a test's reliability after changing its length, converts it to any other length. Rearranged, it gives the number of games needed for a chosen reliability. For a reliability of .5 (half the variation between teams is signal, half is noise) it reduces to:
games for .5 = (games in a half) x (1 - r) / r

offensive EPA per play: r = .634, a half = 8.10 games on average
games for .5 = 8.10 x (1 - .634) / .634 = 8.10 x .366 / .634 = 4.68  -> about 5 games
full-season reliability (two halves): 2 x .634 / (1 + .634) = .776
The same arithmetic puts net EPA per play at 6.8 games, point margin at 7.2, the win-loss record at 9.0 and defensive EPA per play at 15.1. Turnover margin needs 40.7 games, about two and a half seasons; one-score record 79.5 games; field goal percentage 113.8 games. Fumble recovery rate never gets there, because its split-half correlation is below zero. A full season of one-score games has a reliability of .169, which is why a team's close-game record says so little about the next year.
Two Seasons That Followed the Efficiency, Not the Record
Baltimore, 2021. After eight games the Ravens were 6-2, 4-1 in one-score games, with a point margin of +26 (221-195, 10th in the league) and a net EPA per play of +.005, 19th. The record said contender; the efficiency said average. Over the last nine games they went 2-7, 2-5 in one-score games, were outscored 197-166 and posted a net EPA of -.135, and finished 8-9. These numbers do not record who was on the field, so they cannot say how much of the decline came from injuries or lineup changes; what they do show is that the first eight games' efficiency had not promised a 6-2 team.
Jacksonville, 2022. The mirror image. After eight games the Jaguars were 2-6 and 0-6 in one-score games, yet had outscored opponents 172-158 (+14, 10th) and ranked 8th in net EPA per play at +.045. Over the last nine games they went 7-2, 4-0 in one-score games, outscored opponents 232-192 with a net of +.082, and finished 9-8. A 0-6 record in close games had been the least predictive number in their season.
Reading a Season in Progress
The practical order, from this table: start with point margin and per-play efficiency, lean on offense more than defense, and discount anything built on fumble bounces, field goal streaks or close-game finishes. The EPA rankings after week 7 list the 2026 teams whose records and efficiency disagree, and the wins needed for the playoffs put those records in context. For the metrics themselves, how EPA is calculated and success rate explain the two most stable numbers here.
Limitations
- Averages over many teams. A correlation of .461 says how much of the first eight games usually carries forward across 767 team-seasons. It does not forecast any single team, and injuries, trades and lineup changes are invisible to every column.
- Halves share a schedule. The odd and even games mix home and road and early and late games, but the opponents differ. Opponent strength adds noise that the raw stats do not remove, and no stat here is adjusted for it.
- Correlation, not cause. A stat that tracks later wins may do so because it travels with something else, as turnover margin travels with efficiency.
- Small denominators. One-score record uses only the close games in each half (a median of four), so 764 team-seasons have a value for both halves and 763 for the first eight games. Field goal percentage rests on a few kicks a game.
- Coverage. Fumbles are offensive (sacks, runs and receptions); special-teams fumbles are not counted. Third downs are measured on 2016-2025 only. Jacksonville 2002 is left out because the nflverse team-stat file has none of its eight home games.
- The EPA scale is nflverse's. A different expected-points table would move every efficiency number a little.
Method and Reproducibility
sample      = 2002-2025 regular seasons, 767 team-seasons (Jacksonville 2002 left out), 12,430 team-games
play        = run or pass with an EPA value (sacks and scrambles count as passes); success = EPA > 0
split-half  = Pearson r between the stat in a team's odd-numbered and even-numbered games
forecast    = Pearson r between the stat over games 1-8 and the win share over games 9-16/17 (ties = half a win)
next season = Pearson r between a franchise's full-season stat and its stat the next season (735 pairs)
games for .5 = 8.10 x (1 - r) / r   (Spearman-Brown; 8.10 = average games per half)
turnover margin = (opponent interceptions + lost fumbles) - (own interceptions + lost fumbles), per game
fumble recovery rate = (own fumbles not lost + opponent fumbles lost) / all fumbles in the team's games
one-score game = final margin of 8 points or fewer
team codes  = the game log's OAK, SD and STL mapped to the play-by-play's LV, LAC and LA
The script make_predictive_analytics_chart.py checks every input against its recorded hash, joins the 12,446 play-by-play team-games to the game log and the team-stat file (asserting that each team is exactly one of home or away and that Jacksonville's 2002 home games are the only gap), rebuilds the 24 stats for every split, recomputes every correlation, the Spearman-Brown figures, the regression groups and both worked examples, draws the exhibit and asserts each number on this page. Data pulled 4:58 am UTC on October 28, 2026; the play-by-play team-game table was built October 14, 2026 from the same releases.
Sources: nflverse play-by-play and team-stat releases and the nflverse game log; field definitions from the nflreadr data dictionaries (play-by-play, stats); Wikipedia, Predictive analytics, Spearman-Brown prediction formula and Regression toward the mean; all read October 28, 2026.
Further reading
- Turnovers and Luck: why the most decisive play in a game is the least repeatable
- Close-Game Luck: one-score records from one season to the next
- Pythagorean Wins: what points scored and allowed say a record should be
- NFL EPA Rankings After Week 7: all 32 teams in 2026
- Success Rate: the yes-or-no version of EPA
- The Week 1 Signal: how much a single game says
Your team
Kept in this browser only.
Pick the playoffs
Pick the games left and see both conferences’ seeds under the NFL’s tie-breakers.
Go deeper
Want the code behind these metrics? Work through the 43-chapter NFL analytics tutorial.
Browse tutorials Free tools