What is a three-down back?
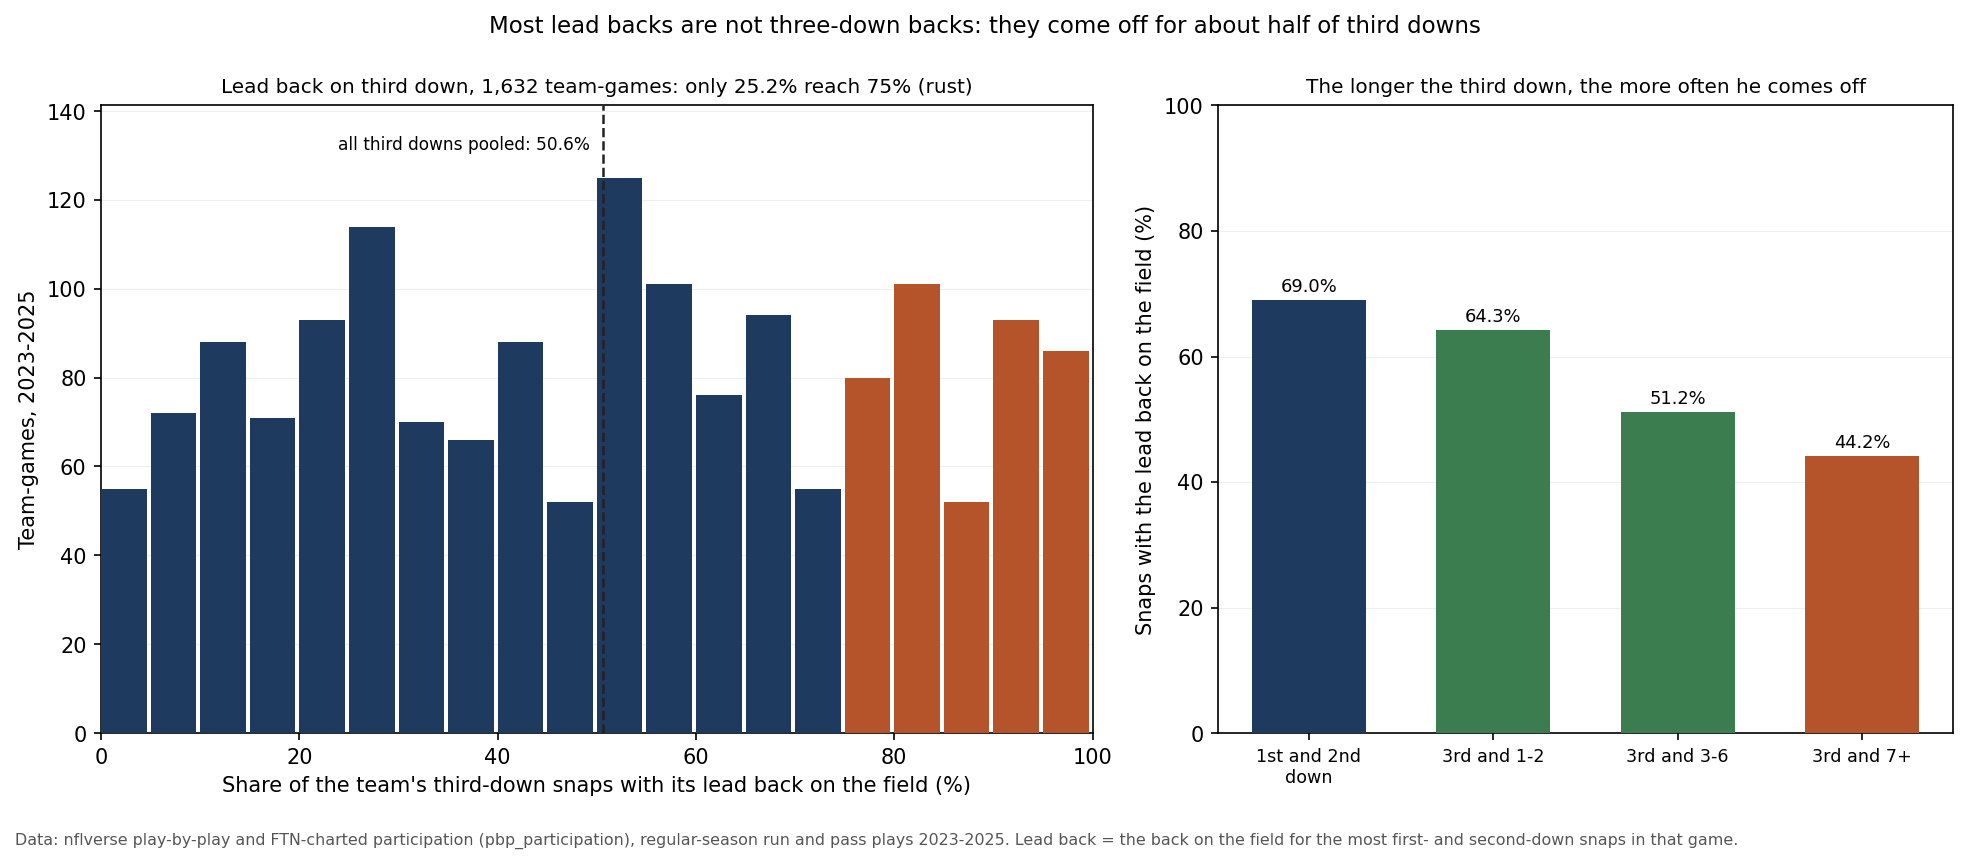
A three-down back is a running back who stays on the field on first, second and third down. He carries the ball on early downs and stays in on third down to catch passes and pick up blitzes, instead of handing third down to a "third-down back", the passing-down specialist many teams bring in on third and long. Real three-down backs are rarer than the label: from 2023 to 2025 a team's lead back was on the field for 69.0% of its first- and second-down snaps but only 50.6% of its third-down snaps, and he stayed in for at least three of every four third downs in just 25.2% of games.
Related: third-down conversions · snap counts and usage · pass protection
Figures from nflverse play-by-play with FTN-charted participation (which players were on the field for each play), every regular-season game from 2023 to 2025, and 2026 play-by-play for the 121 games through Monday, November 2 (weeks 1 to 8), read November 4, 2026.
Three-Down Back vs Third-Down Back
The two terms sound alike and mean nearly opposite things.
- Three-down back. One running back handles every down. When Houston traded for David Montgomery in the 2026 offseason, Texans running backs coach and assistant head coach Danny Barrett told KPRC 2's Aaron Wilson, as NFL.com reported: "He's a three-down back," and "He can do it all." The Jets' Breece Hall, quoted by NFL.com, said the same of himself: "I feel like my skill set, I'm a three-down back."
- Third-down back. A specialist who comes in for passing downs. Wikipedia's running back article describes him as a back "skilled at catching passes or better at pass blocking and 'picking up the blitz', and thus is often put in the game on third down and long."
- Feature back and committee. A feature back is the team's main back. Wikipedia calls the most common split as of the 2023 season the "70-30 rotation": a featured back takes most of the snaps while one or more change-of-pace backs take the rest. A feature back is not automatically a three-down back; the question is whether he stays on the field when the down changes.
Third down is where the job changes. On first down a team had two backs on the field for 12.4% of its snaps; on third down that fell to 4.0%, and 94.3% of third-down snaps had exactly one back. So the third-down question is simply which back that one is.
How Often the Lead Back Stays On
For every team in every game of the last three regular seasons, the lead back here is the back on the field for the most of that team's first- and second-down snaps. The question is how many of the same team's third-down snaps he also played.
| Season | Snaps | 1st and 2nd down | 3rd down | Games 75%+ on 3rd | Games 90%+ on 3rd |
|---|---|---|---|---|---|
| 2023 | 33,043 | 68.5% | 49.1% | 23.7% | 9.4% |
| 2024 | 32,571 | 69.0% | 51.6% | 24.1% | 12.5% |
| 2025 | 31,931 | 69.4% | 51.2% | 27.9% | 11.0% |
The lead back's early-down share barely moved, 68.5% to 69.4%, and his third-down share sat near half every year. Over the three seasons he played at least 75% of the third downs in 412 of the 1,632 team-games (25.2%) and at least 90% in 179 (11.0%). In 379 games (23.2%) he played fewer than a quarter of them. The left panel shows how wide that range is: there is no typical third-down workload for a lead back, only teams that keep him on and teams that take him off.
Third and Long Is Where He Comes Off
The longer the third down, the more likely the specialist is in. On third and 1 or 2, the lead back was on the field for 64.3% of 4,252 snaps, close to his early-down rate. On third and 3 to 6 that fell to 51.2% of 6,887 snaps, and on third and 7 or more to 44.2% of 9,630. That is the pattern Wikipedia's description predicts: the swap happens on obvious passing downs, when a back's blocking and catching matter more than his running.
When the lead back did come off on third down, another back almost always replaced him rather than an extra receiver: of those 10,259 snaps, 96.5% still had a back on the field and 3.5% had an empty backfield.
The Three-Down Backs of 2025
Thirty-one backs were their team's lead back in at least 9 games of 2025. In those games, these ten played the largest share of their team's third-down snaps.
| Player | Team | Lead games | 1st and 2nd down | 3rd down |
|---|---|---|---|---|
| Christian McCaffrey | SF | 17 | 81.1% | 96.2% |
| Rhamondre Stevenson | NE | 9 | 66.0% | 83.5% |
| Bijan Robinson | ATL | 17 | 79.2% | 81.0% |
| Jonathan Taylor | IND | 17 | 84.3% | 78.2% |
| Kyren Williams | LAR | 17 | 66.2% | 77.7% |
| Kimani Vidal | LAC | 9 | 70.9% | 75.0% |
| Javonte Williams | DAL | 14 | 76.6% | 73.3% |
| De'Von Achane | MIA | 15 | 81.7% | 71.0% |
| Saquon Barkley | PHI | 16 | 82.2% | 67.9% |
| Ashton Jeanty | LV | 17 | 82.6% | 66.7% |
Christian McCaffrey is the clearest three-down back in the data: in 17 games he was on the field for 96.2% of San Francisco's third-down snaps, more than his 81.1% on early downs. Jonathan Taylor, Saquon Barkley and Ashton Jeanty each played more than 82% of their teams' early-down snaps but played fewer of the third downs, so even the heaviest early-down workloads do not always carry over.
At the other end, the five lowest played 22.0% of their team's third downs or fewer, and in each case one teammate played most of the rest.
| Player | Team | Lead games | 1st and 2nd down | 3rd down | Third-down back (snaps of team's 3rd downs) |
|---|---|---|---|---|---|
| J.K. Dobbins | DEN | 10 | 59.6% | 22.0% | Tyler Badie (57 of 132) |
| James Cook | BUF | 16 | 73.6% | 21.8% | Ty Johnson (139 of 193) |
| Quinshon Judkins | CLE | 12 | 65.0% | 20.0% | Jerome Ford (82 of 165) |
| Isiah Pacheco | KC | 10 | 68.5% | 15.5% | Kareem Hunt (83 of 116) |
| Jacory Croskey-Merritt | WAS | 10 | 62.6% | 7.0% | Jeremy McNichols (83 of 100) |
James Cook played 73.6% of Buffalo's early-down snaps in his 16 lead games and 21.8% of its third downs, while Ty Johnson played 139 of the 193. Washington's split was the sharpest: Jacory Croskey-Merritt played 7.0% of the third downs in his 10 lead games and Jeremy McNichols 83 of the 100.
2026 So Far: Who Gets the Third-Down Touches
Participation for 2026 has not been published yet, so this season's table uses touches instead of snaps: carries plus targets for running backs, from the play-by-play. The check on 2025 shows how close that comes. For the 31 lead backs above, the share of their team's third-down running back touches tracked their share of third-down snaps with a correlation of 0.86, but it ran about 4 points higher on average (54.4% against 50.1%) and missed by 10.2 points for a typical back. Read the 2026 column as a close guide, not a snap count, and note how few third-down touches each team has had in eight weeks.
| Team | Lead back | 1st and 2nd down touches | 3rd down touches | 3rd down share |
|---|---|---|---|---|
| IND | Jonathan Taylor | 159 of 204 | 18 of 20 | 90.0% |
| DET | Jahmyr Gibbs | 179 of 209 | 20 of 23 | 87.0% |
| LAR | Kyren Williams | 122 of 212 | 28 of 33 | 84.8% |
| CAR | Chuba Hubbard | 117 of 155 | 23 of 29 | 79.3% |
| LV | Ashton Jeanty | 136 of 213 | 17 of 22 | 77.3% |
| NE | Rhamondre Stevenson | 101 of 203 | 20 of 27 | 74.1% |
| HOU | Woody Marks | 82 of 141 | 11 of 15 | 73.3% |
| KC | Kenneth Walker III | 147 of 176 | 20 of 28 | 71.4% |
| PIT | Jaylen Warren | 135 of 198 | 19 of 27 | 70.4% |
| SF | Christian McCaffrey | 108 of 179 | 17 of 25 | 68.0% |
| ATL | Bijan Robinson | 161 of 218 | 21 of 31 | 67.7% |
| DAL | Javonte Williams | 137 of 176 | 18 of 27 | 66.7% |
| MIN | Aaron Jones | 117 of 168 | 11 of 17 | 64.7% |
| CHI | D'Andre Swift | 141 of 230 | 23 of 37 | 62.2% |
| NYG | Cam Skattebo | 98 of 174 | 13 of 24 | 54.2% |
| NYJ | Braelon Allen | 119 of 189 | 12 of 24 | 50.0% |
| BUF | James Cook | 148 of 175 | 6 of 12 | 50.0% |
| TEN | Tony Pollard | 141 of 177 | 11 of 22 | 50.0% |
| LAC | Omarion Hampton | 93 of 186 | 9 of 19 | 47.4% |
| MIA | Ollie Gordon II | 89 of 150 | 10 of 22 | 45.5% |
| CIN | Chase Brown | 122 of 156 | 12 of 27 | 44.4% |
| CLE | Quinshon Judkins | 115 of 170 | 7 of 19 | 36.8% |
| SEA | Emanuel Wilson | 110 of 218 | 9 of 25 | 36.0% |
| BAL | Derrick Henry | 160 of 198 | 9 of 26 | 34.6% |
| TB | Bucky Irving | 158 of 221 | 12 of 36 | 33.3% |
| NO | Kendre Miller | 64 of 183 | 6 of 20 | 30.0% |
| ARI | Jeremiyah Love | 84 of 197 | 5 of 23 | 21.7% |
| JAX | Bhayshul Tuten | 118 of 170 | 6 of 28 | 21.4% |
| DEN | J.K. Dobbins | 99 of 186 | 4 of 24 | 16.7% |
| GB | MarShawn Lloyd | 70 of 172 | 4 of 24 | 16.7% |
| PHI | Saquon Barkley | 64 of 180 | 2 of 20 | 10.0% |
| WAS | Jacory Croskey-Merritt | 70 of 158 | 2 of 24 | 8.3% |
Five lead backs have had at least 75% of their team's third-down running back touches: Jonathan Taylor (18 of 20), Jahmyr Gibbs (20 of 23), Kyren Williams (28 of 33), Chuba Hubbard (23 of 29) and Ashton Jeanty (17 of 22). Six have had fewer than a quarter, with Washington's Jacory Croskey-Merritt again lowest at 2 of 24.
Houston is the test of the preseason label. In weeks 1 to 5, the weeks David Montgomery appears in the snap counts, he had more first- and second-down touches than Woody Marks (52 to 47), but Marks had twice as many on third down (8 to 4). That is the split NFL.com's story anticipated when it said "The change-of-pace youngster could take the third-down role", not a three-down back. Montgomery is not in the snap counts for weeks 6 and 7, and Marks leads Houston for the season on both early downs and third down. The samples are small, a dozen third-down touches, so this is a reading of eight weeks, not a verdict.
What This Page Does Not Show
- What the back did on the snap. Participation says who was on the field, not whether he blocked, ran a route or carried the ball.
- Why a back came off. Injuries during a game, a lopsided score or a two-minute drill all change who plays third down; the shares above include them.
- 2026 snaps by down. Until 2026 participation is published, the 2026 table counts touches, which run a few points higher than snaps for lead backs.
Method and Reproducibility
snap        = regular-season run or pass play on 1st, 2nd or 3rd down (no kneels, spikes or no-plays),
              2023-2025: 97,545 snaps, each matched to its nflverse pbp_participation row
back        = a player charted RB or FB in the participation's offense_positions
lead back   = per team-game, the back on the field for the most 1st- and 2nd-down snaps
              (ties broken by 3rd-down snaps)
3rd share   = 3rd-down snaps with the lead back on the field / the team's 3rd-down snaps in that game
2025 table  = player-seasons with 9+ lead games; shares pooled over those games
2026 table  = touches (carries + targets) by players listed RB or FB on the 2026 roster,
              121 games through Monday, November 2 (weeks 1-8)
The script make_three_down_back_chart.py checks the frozen files against their recorded hashes, joins every 2023-2025 snap to its participation row, rebuilds the lead back for all 1,632 team-games, the season, distance and player tables and the 2025 touch check, rebuilds the 2026 touch table and the Houston split, then draws the exhibit and asserts each number on this page, including the quoted definitions against saved copies of the sources. The data was frozen at 1:43 pm UTC on November 4, 2026.
Sources: nflverse play-by-play, participation (FTN charting) for 2023-2025, snap counts and the 2026 roster; NFL.com, Texans view David Montgomery as a 'three-down back' and Jets RB Breece Hall out 'to prove that I am the guy'; Wikipedia, Running back. All read November 4, 2026.
Further reading
- Third-Down Conversions: why the money down is won on first and second down
- Down and Distance: what 3rd and 12 means and what each down is worth
- Snap Counts and Usage: opportunity before production
- Pass Protection: sacks, pressure and who is to blame
- Rushing Yards Over Expected: the efficiency side of running back usage
Your team
Kept in this browser only.
Pick the playoffs
Pick the games left and see both conferences’ seeds under the NFL’s tie-breakers.
Go deeper
Want the code behind these metrics? Work through the 43-chapter NFL analytics tutorial.
Browse tutorials Free tools